Streaming Data Between kdb+ and PubSub+
Solace has been serving the financial industry with its industry leading event broker, PubSub+, for

This is the third post in a series about the new Solace/kdb+ API. I suggest you read the previous posts about streaming data between kdb+ and PubSub+ and bringing the power of pub/sub messaging to kdb+.
A typical kdb+ architecture consists of several q processes tightly coupled together and maybe a Java feed handler. The feed handler is responsible for capturing market data and sending it to a ticker plant which then routes it to different real-time subscribers. The most popular real-time subscriber is RDB (realtime database) which keeps the raw real-time data in memory and then persists it to disk at the end of the day.
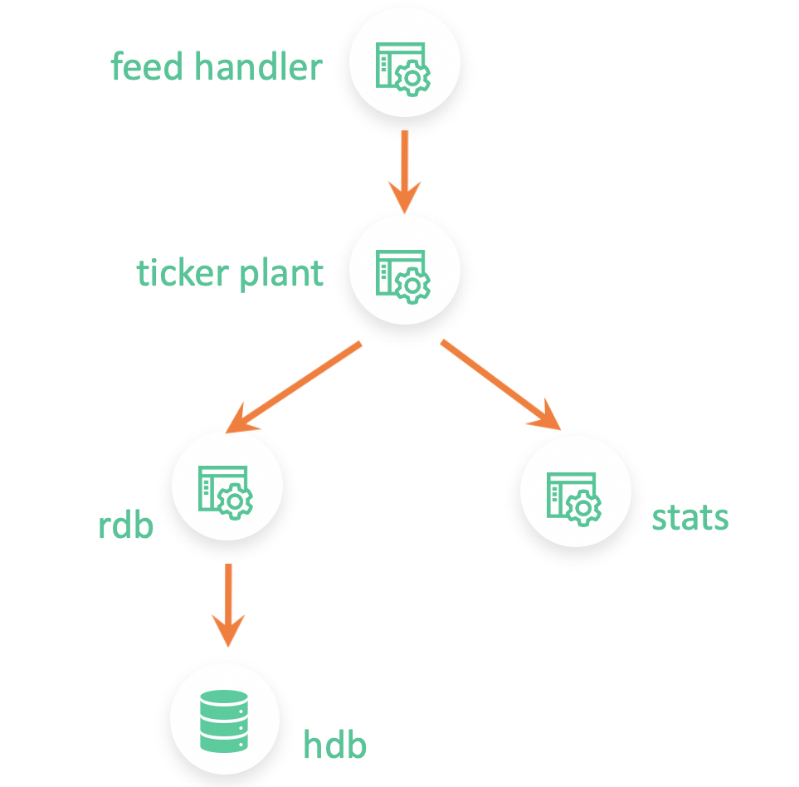
The second most popular real-time subscriber is usually a bar generation process that also subscribes to real-time updates, just like the RDB, from the ticker plant. However, instead of saving the raw updates, this process computes real-time analytics. These stats are usually computed every minute but can differ depending on the individual use case. This bar generation process either persists the data to disk and/or sends it off to another process interested in this data.
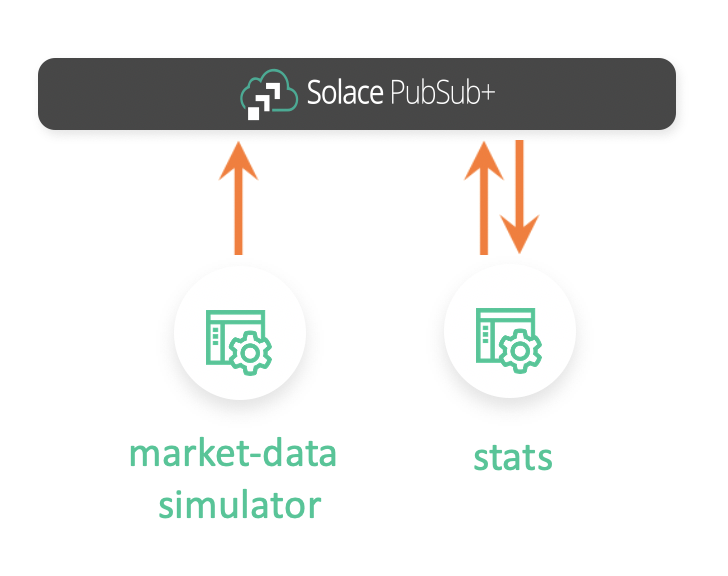
In this post, I would like to show you how your bar generation process can consume streaming data from Solace’s PubSub+ Event Broker, generate minutely statistics, and then publish those stats back to PubSub+ on dynamic topics.
You can find the code of the q process here.
I will be using a market-data-simulator (github | blog post) which I have previously coded to generate simulated market data for us. It’s a simple application that can be configured to generate L1 market data for certain stocks.
The simulator publishes data to PubSub+ topics of this syntax:
<assetClass>/marketData/v1/<country>/<exchange>/<sym>
For example, AAPL’s data will be published on EQ/marketData/v1/US/NASDAQ/AAPL and IBM’s data will be published on EQ/marketData/v1/US/NYSE/IBM.
By default, the simulator is configured to publish data for multiple stocks from 4 exchanges: NYSE, NASDAQ, LSE, and SGX.
For the market data simulator to work, we need to have a running instance of Solace’s PubSub+ Event Broker. There are two easy ways to get started:
I will be using a local PubSub+ instance.
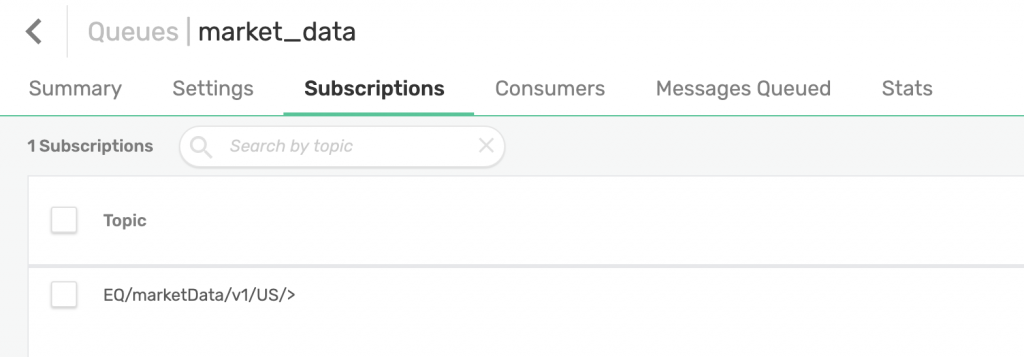
To consume this data, we can either subscribe directly to the topics or create a queue and map the topic(s) to it. In production, working with high volume market data, you would typically subscribe to topics but for our use case, we will be subscribing to a queue.
We can use Solace’s rich hierarchical topics and wildcard filtering to select which topics we are interested in. For example, we can receive data only for US exchanges by adding this topic subscription to our queue: EQ/marketData/v1/US/>. We can also choose to subscribe to updates from a certain exchange only: EQ/marketData/v1/*/LSE/>.
The script creates a queue called market_data and maps a topic to it: EQ/marketData/v1/US/>.
We will be using Kx’s Solace interface to kdb+ to communicate with our PubSub+ instance.
// Market Data queue that we would like to subscribe to
subQueue:`$"market_data";
topicToMap:`$"EQ/marketData/v1/US/>";

-1"### Creating endpoint";
.solace.createEndpoint[;1i]`ENDPOINT_ID`ENDPOINT_PERMISSION`ENDPOINT_ACCESSTYPE`ENDPOINT_NAME!`2`c`1,subQueue;

-1"### Mapping topic: ", (string topicToMap), " to queue";
.solace.endpointTopicSubscribe[;2i;topicToMap]`ENDPOINT_ID`ENDPOINT_NAME!(`2;subQueue);
My q bar generation process, gen_stats.q, loads sol_init.q file which consists of connection settings and some other information required to establish a connection with my local PubSub+ instance.
I defined a global table, prices, for keeping track of the latest updates:
prices:flip (`date`time`sym`exchange`currency`askPrice`askSize`bidPrice`bidSize`tradePrice`tradeSize)!(`date$();`time$();`symbol$();`symbol$();`symbol$();`float$();`float$();`float$();`float$();`float$();`float$());
Then, I defined our callback function, subUpdate, which will be triggered every time there is a new message. In this function, I parse the incoming message and insert it into our prices table.
Then, I defined a function, updateStats, that will be triggered every minute via .z.ts. This function selects rows from prices that arrived within the last minute and computes stats such as highPrice, lowPrice, highAskPrice, lowAskPrice, vwap, etc.
// Generate minutely stats on data from last min`prices set rawTable:select from rawTable where time>.z.T-00:01;stats:select lowAskSize: min askSize,highAskSize: max askSize,lowBidPrice: min bidPrice,highBidPrice: max bidPrice,lowBidSize: min bidSize,highBidSize: max bidSize,lowTradePrice: min tradePrice,highTradePrice: max tradePrice,lowTradeSize: min tradeSize,highTradeSize: max tradeSize,lowAskPrice: min askPrice,highAskPrice: max askPrice,vwap:tradePrice wavg tradeSize by date, sym, time:1 xbar time.minute from rawTable;stats:select from stats where time=max time;
Then, for each symbol, it generates a dynamic topic and publishes the stats for each symbol to their specific PubSub+ topic. For example, stats for AAPL are published to EQ/stats/v1/AAPL and stats for IBM are published to EQ/stats/v1/IBM.
On PubSub+, we have created another queue called stats which we will attract all stats messages by subscribing to EQ/stats/>.
And that’s it!
Now that we understand the flow better, let’s run our market data simulator and bar generation process.
I have modified the simulator code a bit to log the messages it is publishing:
=======================================================Publishing to topic: EQ/marketData/v1/US/NASDAQ/AAPLData: {"date":"2020-06-08","symbol":"AAPL","askPrice":260.145,"bidSize":790,"tradeSize":340,"exchange":"NASDAQ","currency":"USD","time":"15:42:13.805925-04:00","tradePrice":256.93332,"askSize":760,"bidPrice":253.72165}==============================================================================================================Publishing to topic: EQ/marketData/v1/US/NASDAQ/FBData: {"date":"2020-06-08","symbol":"FB","askPrice":170.17534,"bidSize":560,"tradeSize":350,"exchange":"NASDAQ","currency":"USD","time":"15:42:13.825708-04:00","tradePrice":168.49043,"askSize":380,"bidPrice":166.80553}==============================================================================================================Publishing to topic: EQ/marketData/v1/US/NASDAQ/INTCData: {"date":"2020-06-08","symbol":"INTC","askPrice":59.54003,"bidSize":520,"tradeSize":280,"exchange":"NASDAQ","currency":"USD","time":"15:42:13.840505-04:00","tradePrice":59.023575,"askSize":560,"bidPrice":58.50712}=======================================================
As you can see, we are publishing messages to PubSub+ topics.
Now, it’s time to run our bar generation q process. You can see that our q process is receiving the raw updates:
q)pricesdate time sym exchange currency askPrice askSize bidPrice bidSize tradePrice tradeSize-------------------------------------------------------------------------------------------2020.06.08 15:47:50.732 AAPL NASDAQ USD 249.9859 70 246.2641 460 248.125 1802020.06.08 15:47:50.732 AAPL NASDAQ USD 249.9859 70 246.2641 460 248.125 180200.06.08 15:47:50.945 FB NASDAQ USD 170.8511 780 169.999 50 170.425 3802020.06.08 15:47:50.945 FB NASDAQ USD 170.8511 780 169.999 50 170.425 3802020.06.08 15:47:50.952 INTC NASDAQ USD 61.206 150 59.994 100 60.6 3302020.06.08 15:47:50.952 INTC NASDAQ USD 61.206 150 59.994 100 60.6 3302020.06.08 15:47:50.955 IBM NYSE USD 99.99937 290 99.50063 260 99.75 4902020.06.08 15:47:50.955 IBM NYSE USD 99.99937 290 99.50063 260 99.75 4902020.06.08 15:47:50.960 AC NYSE USD 22.16531 300 21.99969 400 22.0825 430
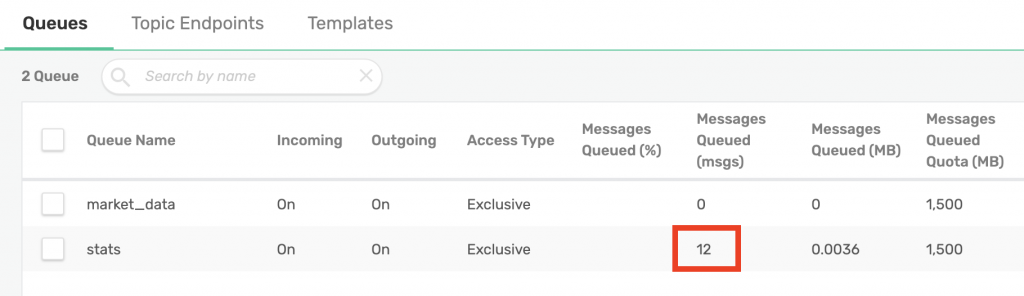
Our market_data queue was generated by the stats script. Additionally, I have administratively created a stats queue from the web UI with the appropriate subscription to capture stats generated by our script:
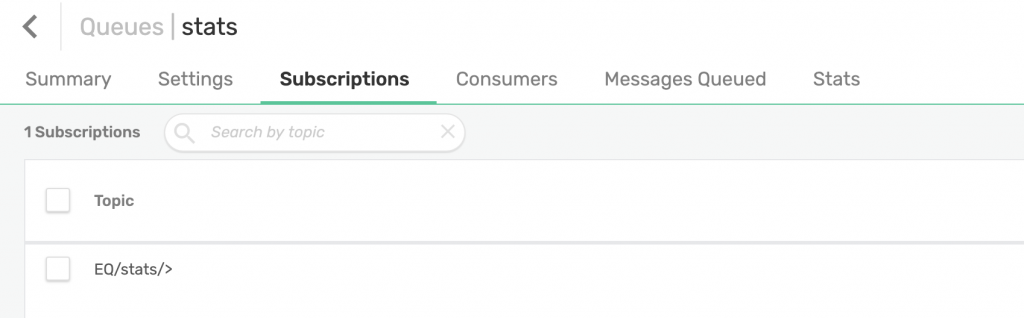
Additionally, you can see that our stats queue is receiving minutely stats:
We can also use Solace’s Try Me! subscriber app to subscribe to these stats and inspect the data:
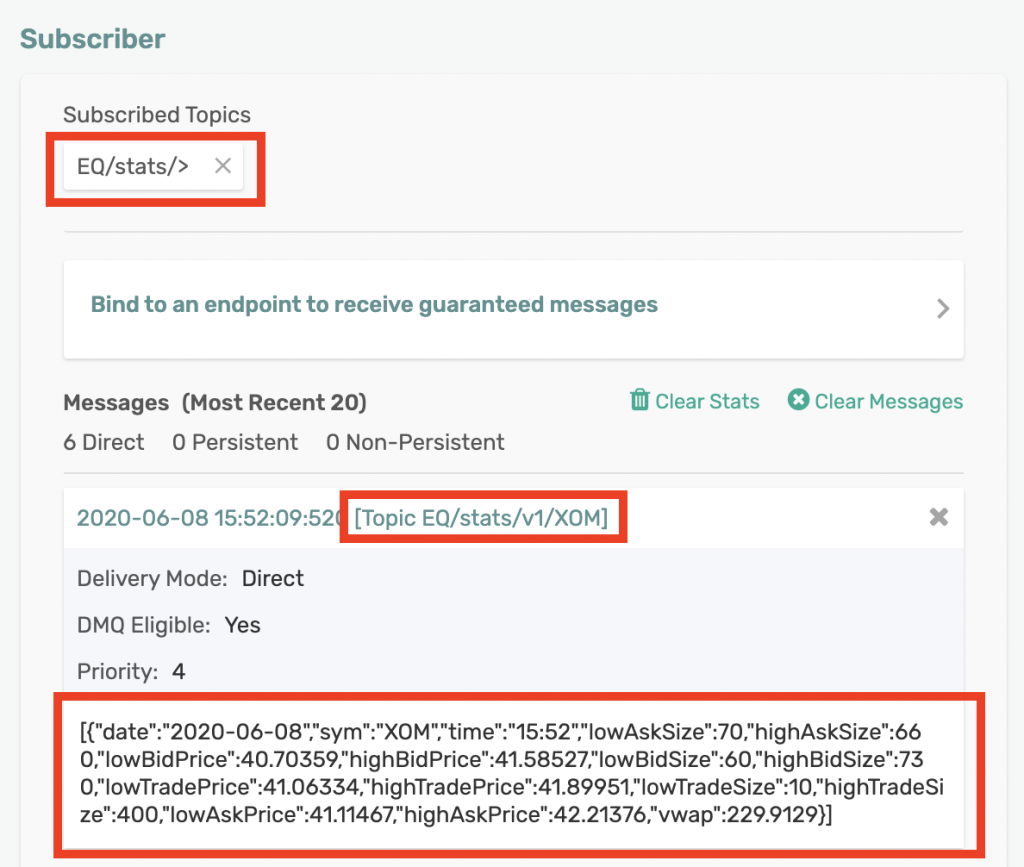
As we can see from the screenshot above, by subscribing to EQ/stats/>, we are receiving data sent to any topic that falls in that hierarchy such as EQ/stats/v1/XOM. The payload for our stats messages looks like this:
[{"date":"2020-06-08","sym":"XOM","time":"15:54","lowAskSize":100,"highAskSize":630,"lowBidPrice":45.00016,"highBidPrice":46.67166,"lowBidSize":80,"highBidSize":620,"lowTradePrice":45.34021,"highTradePrice":46.9059,"lowTradeSize":60,"highTradeSize":490,"lowAskPrice":45.62594,"highAskPrice":47.43359,"vwap":332.7994}]
That’s a wrap! In this post, I showed you how you can consume raw streaming data from PubSub+ from within your q process, generate stats on the raw data, and then publish the stats back to PubSub+ using dynamic topics.
By using PubSub+ as your distribution layer, you have removed your stats process’s dependency on the ticker plant. Additionally, your kdb+ stack is now loosely coupled. You are also able to take advantage of PubSub+’s rich hierarchical topics and wildcard filtering.


Subscribe to Our Blog
Get the latest trends, solutions, and insights into the event-driven future every week.
By submitting this form, you agree to Solace’s privacy policy: solace.com/privacy-policy/