
Many IoT projects start with a prototype. We test different sensors, their connectivity within their target surroundings, and the data transmission from device to IT apps. We also use various cloud services and tools to visualize and analyze the collected data to eventually build our business case.
Once we have understood our use cases and their business value, we are often faced with the problem of creating a robust and production-ready pilot version of the architecture and tooling, albeit small-scale initially. Assuming this pilot is successful, the next questions we will get is ”Can we now roll it out at scale?” or ”How long do you need to roll it out globally?”
In this article, we will explain our journey of creating a foundation based on the Solace Hybrid IoT Event Mesh concept that allows you to go from a small-scale prototype to a full-blown global roll-out of your project to any size or geographic reach without re-architecting or re-developing any of your applications.
The guiding principle of our project was to provide maximum agility and flexibility in these dimensions:
- Geographical deployment across US and Europe
- Various cloud and on-premise deployments such as AWS, Azure and edge gateways
- Evolution and extension of the use case
We have joined forces with a number of leading technology providers such as Dell Boomi, Altair, and SL to show the agility to consume and produce events and messages wherever required. As the prototyping sensor kit we used the Bosch XDK110, a great “cross domain development kit” with sensors such as gyroscope, accelerometer, magnetometer, humidity, temperature, and light.
Using the XDK110, we can target a number of different use cases, from monitoring vibrations of appliances and machines, monitoring transport of fresh food, medicines and vaccines, and fragile cargo as well as environmental conditions in production processes such as industrial painting and coating for optimal temperature and humidity. Yawn …
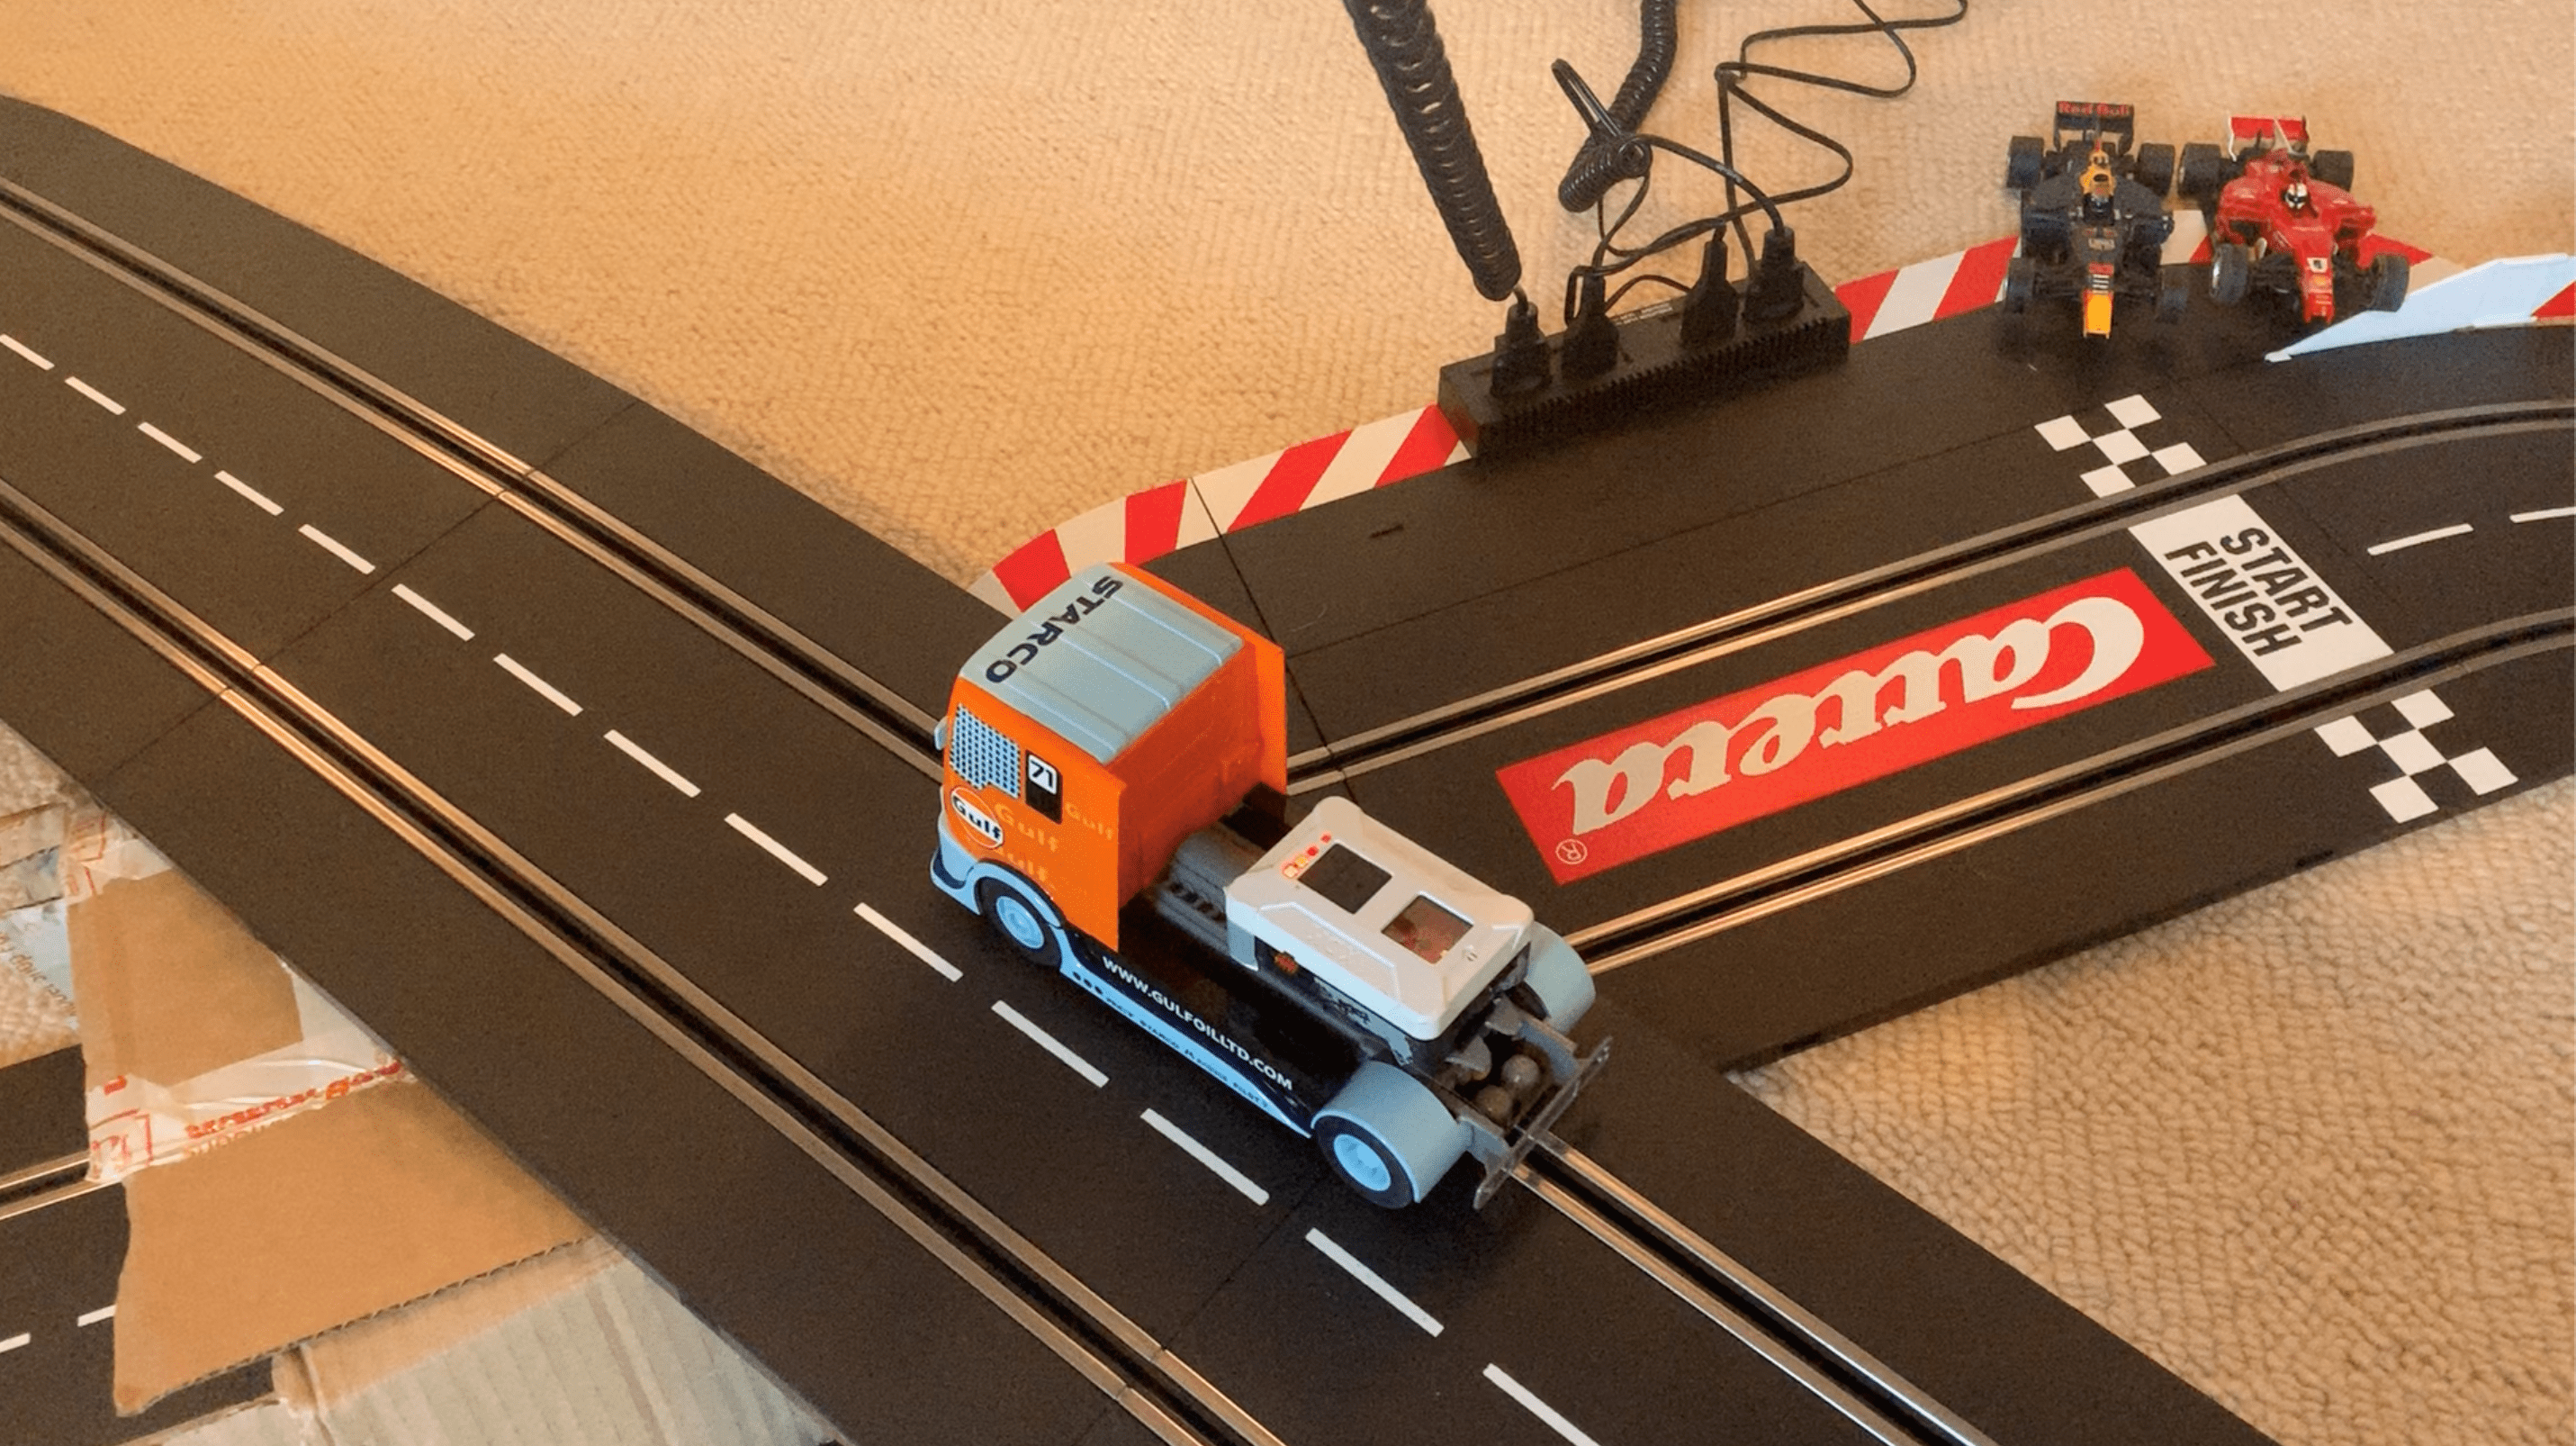
How about we use the same platform instead to monitor slot cars racing around a race track, fully connected and in real time? Count laps, detect crashes, …?
Have a look at this video recorded by SL Corporation to see the race track in action:
Note: Big shout-out to Heather. How does she manage to drive two cars at the same time without crashing them? We cannot do that!
Let’s have a look at the system and its components.
The Solace Client Application for the Bosch XDK110
As mentioned before, we use the Bosch XDK110 as the sensor device. It comes with an Eclipse-based IDE and tons of sample code to base your own project on.
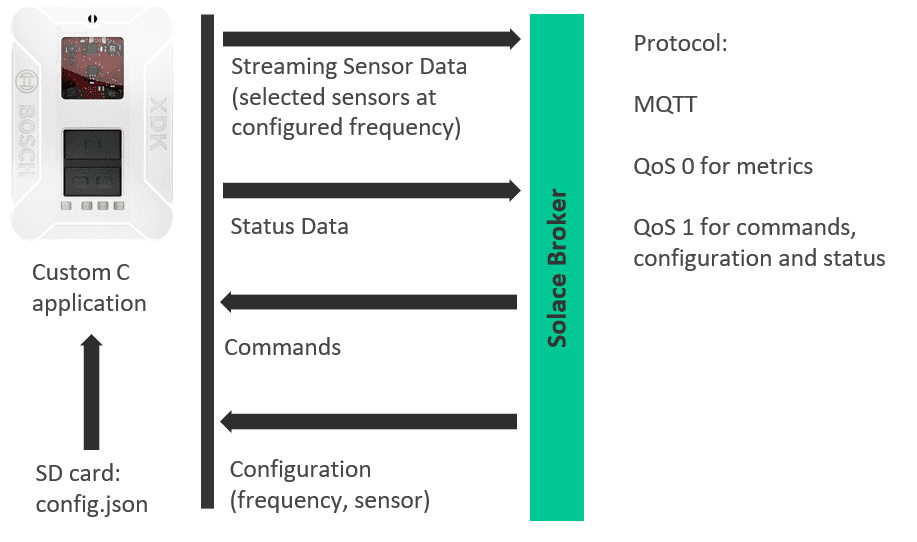
Based on the libraries provided, we developed our own device application with the following interfaces:
- A JSON configuration file with initial connection parameters for WIFI, the Solace MQTT connection, etc.
- A telemetry publisher to send selected sensor data at a configured interval
- A number of subscribers to receive commands and configuration parameters and respond with status messages
By taking advantage of a key feature in Solace, namely the literally unlimited number of topics that can be used, we have created a topic hierarchy to allow for very selective updates to the devices, using wildcards and the event mesh for routing messages from producers to all registered subscribers.
For example, each device subscribes to:
- Configuration messages just for itself using the following example topic string:
UPDATE/iot-control/BCW/solacebooth/racetrack/device/{myDeviceId}/configuration - Configuration messages for all devices within the “BCW/solacebooth/racetrack” region:
UPDATE/iot-control/BCW/solacebooth/racetrack/device/#/configuration - Configuration messages for all devices within the “BCW/solacebooth” region:
UPDATE/iot-control/BCW/solacebooth/#/device/#/configuration
Each device publishes sensor data under the following topic:
CREATE/iot-event/BCW/solacebooth/racetrack/device/{deviceId}/metrics
The topic pattern we use is as follows:
{METHOD}/{base-topic}/{resource-categorization}/{resource}/{id}/{aspect}
with {resource-categorization} split into: {region}/{location}/{production-line}
So, we map the organizational deployment / ownership of the device directly into the topic hierarchy.
By using this topic taxonomy in the event mesh, we have completely removed the requirement of parsing message contents to determine routes with the benefits of saving compute time, increasing throughput, reducing maintenance costs, and improving the agility of the platform. It also allows for fine-grained access control of who can access an API and eventually allows us to create a complete governance model of our events, messages, and routes.
We also wanted to support the concept of re-purposing the same device for different use cases. Logic in the XDK application allows for it to be re-configured to:
- Select which sensor data is sent – any combination of gyroscope, accelerometer, magnetometer, temperature, humidity, and light.
- Select the sampling rate for the sensor data – between 1 per second and 100 per second.
- Select the message stream rate – between 1 and 25 messages per second.
For example, in order to monitor our race track cars, we really only want the gyroscope data (x, y, z). But we need it at a higher sampling rate: 100 samples per second combined into 25 MQTT messages per second, so 4 samples in one message.
To monitor fragile cargo, you would rather need the accelerometer at a very high sampling rate to detect “rough handling”. For monitoring food and medicine transports, you may only be interested in humidity, light, and temperature,but most likely at lower sampling intervals of one to several minutes.
The following figure summarizes the XDK110 application interfaces:
The Reference Platform powered by the Hybrid IoT Event Mesh
Let’s have a closer look at the downstream systems and interactions that are part of the system. The following figure provides an overview:

The applications that need to consume the streaming sensor data here are:
- Asset monitoring
- Visual analytics
- Streaming analytics
- AI/ML modules
These are all the applications or services that subscribe to either selectively or all of the streaming sensor data sent by the devices. The devices themselves are also visible in the topic taxonomy, the tree structure that reflects the “resource categorization” hierarchy {region}/{location}/{production-line}. Using this hierarchy, the user or administrator can select exactly which devices to ingest data from by using topic wildcards in the subscription and close subscriptions for device data that is currently not required.
Now, in order to support the concept of re-purposing / re-configuring the devices “on-the-fly”, the following message sequence is executed:
- The Command & Control service issues a configuration message to one or more XDK devices.
- Each device responds with a Status message, indicating the successful (or not) mode switching.
- The Asset Monitor and the Streaming Analytics service(s) both subscribe to the successful mode-switch status message and store this as the device’s context.
- Now the Streaming Analytics engine receives streaming sensor data from the devices, checks the context of the device and now knows what models / thresholds to apply to the streaming data.
The following figure shows this context switching and monitoring in more detail for the Streaming Analytics engine and what happens to its output:
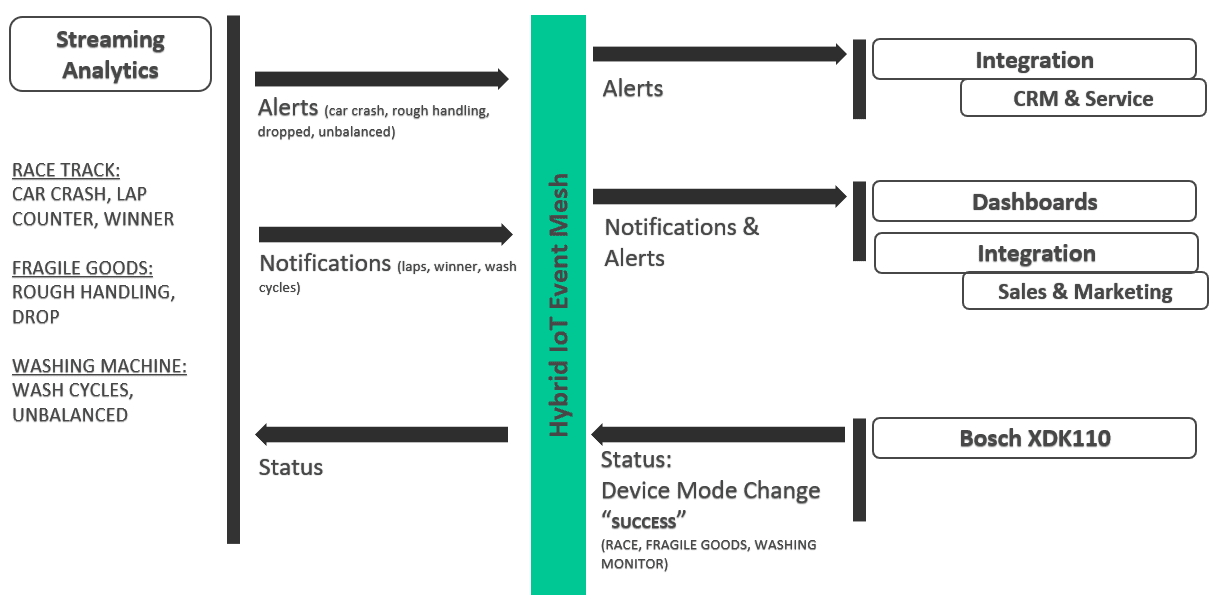
After a “device mode change” (success) message is received by the Streaming Analytics engine, it now applies the correct monitoring model and algorithms for the different use cases such as:
- Detecting car crashes, counting laps, and determining the winner in the race track mode
- Detecting rough handling / dropped packages for the fragile goods transport mode
- Counting wash cycles and detecting a sub-optimal installation for a washing machine
Depending on the model, the streaming analytics engine then sends out alerts or notifications.
Alerts are then forwarded to a CRM & Service module (such as Salesforce), creating a ticket for an agent to take action whereas Notifications & Alerts can be used in the Dashboards as well as for Sales & Marketing and therefore closing the gap from the connected machine to pro-active maintenance and assistance (e.g. “Your washing machine is unbalanced. We can send an engineer to help you prolong its life span.”) as well as sales & marketing (e.g. “You now have completed 10 wash cycles. Isn’t it time for a top-up of your favorite washing powder?”).
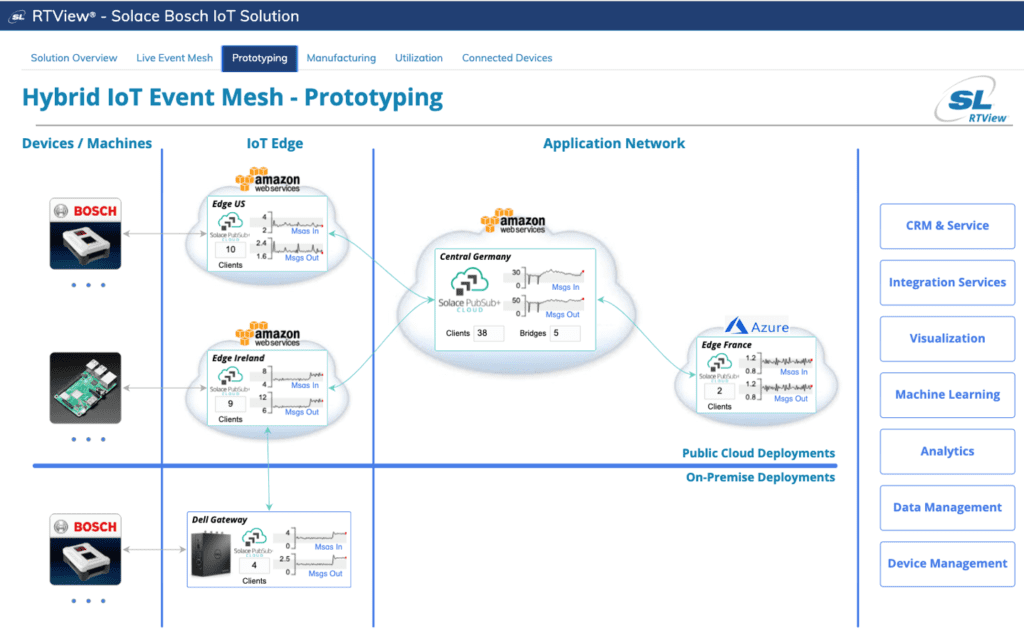
The Hybrid IoT Event Mesh
In order to support these interactions across multiple deployment geographies, we set up an event mesh as shown in this picture:
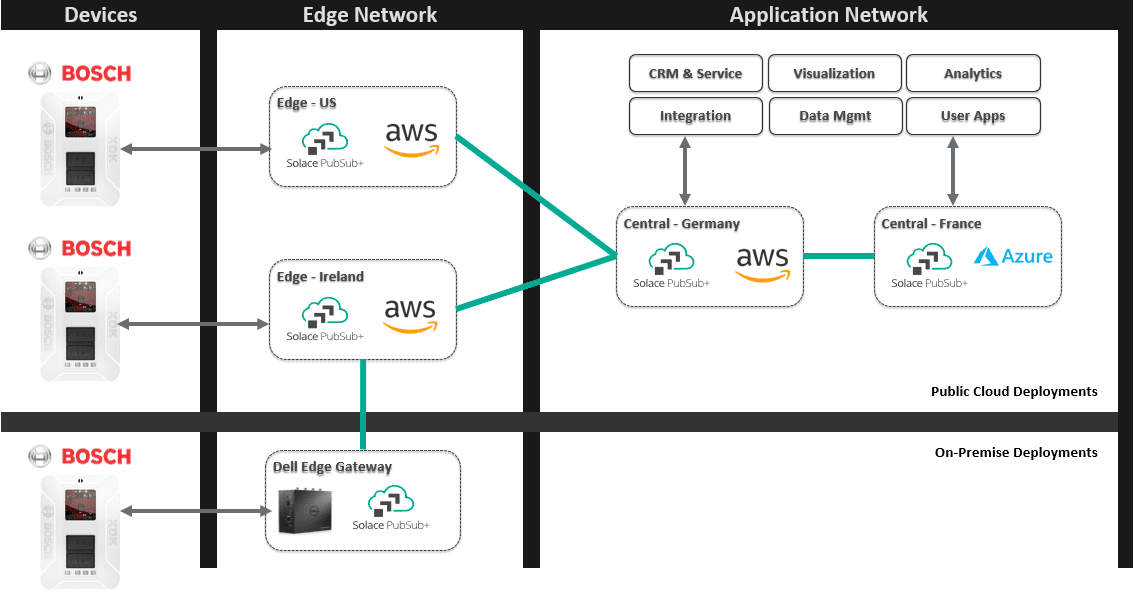
We needed to satisfy the following requirements connecting various XDKs:
- XDKs running in California, connecting to a broker in the US in AWS.
- XDKs running across Europe, connecting to a broker deployed in Ireland AWS.
- XDKs running in a single location with an unreliable connection to the internet. We therefore connected the XDKs to a local edge gateway broker deployed onto a Dell Edge Gateway which in turn is connected to the event mesh through the edge broker running in Ireland in AWS.
The actual applications and services such as CRM, Visualization, Analytics etc. are running in various locations in Europe, so we deployed a broker in AWS in Frankfurt and a broker in Azure in Paris.
The event mesh is created by configuring each of the bridges between brokers to forward subscriptions and data as per the interaction diagram discussed before. We now have a low- latency, seamless, and global data and event distribution platform that allows us to implement these pub/sub, streaming, and queuing interactions.
The next step was to onboard our technology partners to provide the dashboards, integration, and user applications for the platform. The following figure shows the various technologies and functions they fulfill, completing the picture:
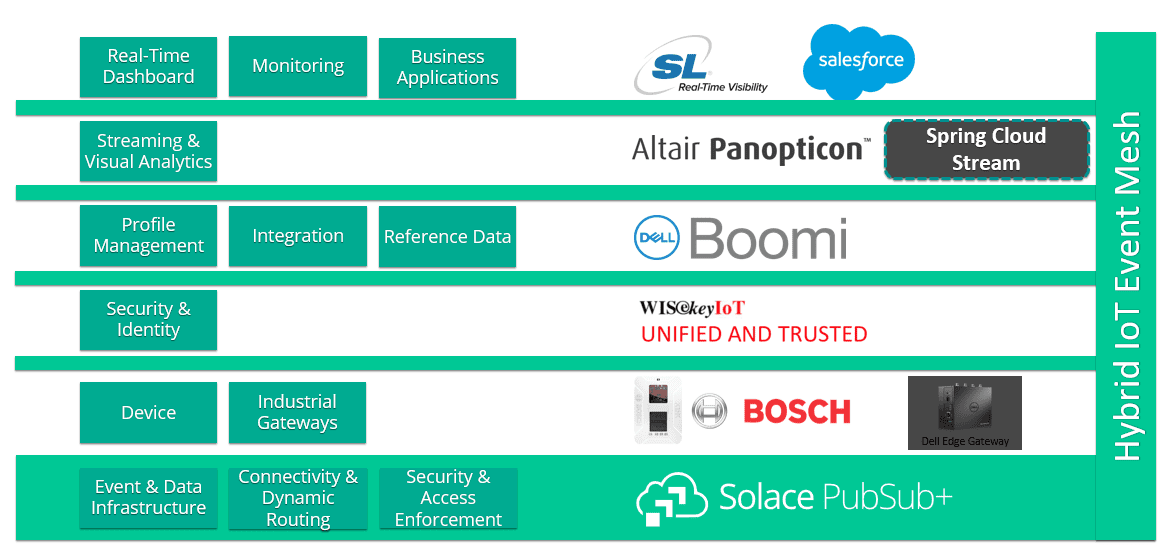
In the next sections, we briefly go through each component.
Visualizing the Event Mesh with SL RTView
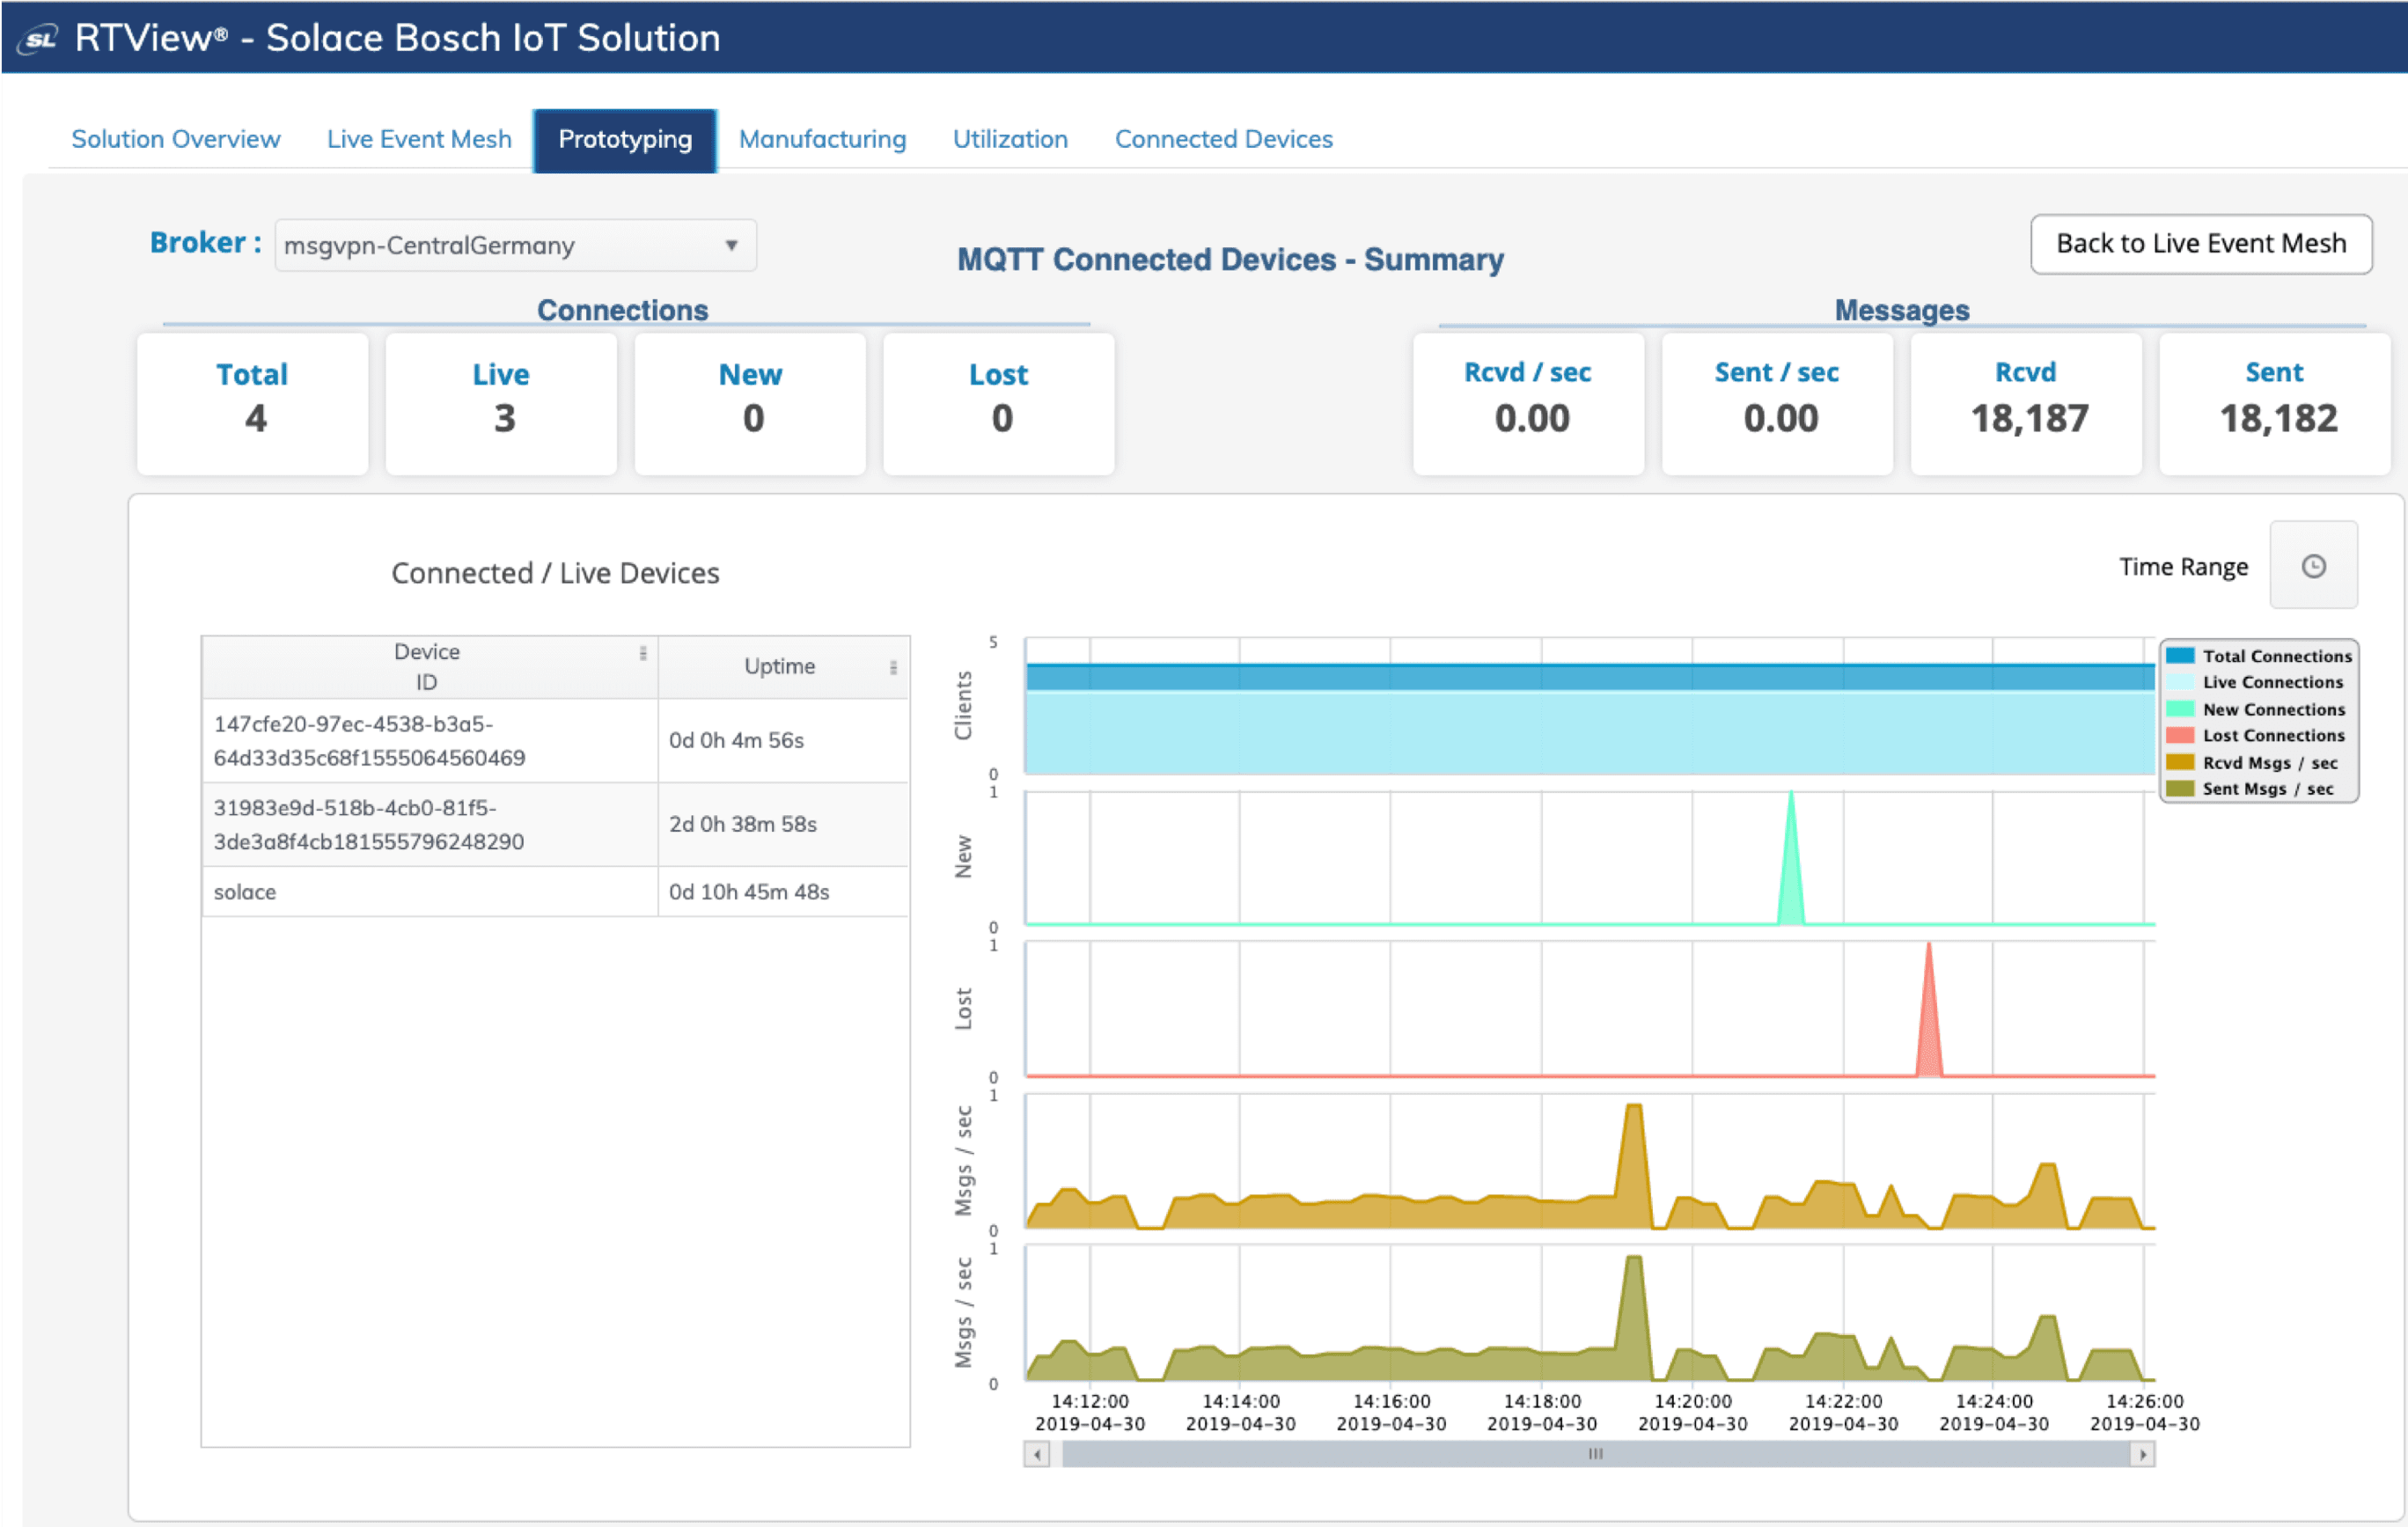
In order to monitor the message flow and connections within the event mesh itself, SL Corporation deployed a cloud-based monitoring system as you can see in the following screenshot:
This monitoring system collects information and statistics from the brokers via the Solace Element Management Protocol or SEMP. SEMP is a RESTful interface that allows remote configuration and monitoring of brokers. In order to monitor brokers behind a firewall, in our case the on-premise broker running on the Dell Edge Gateway, we installed a “collector” module on the gateway itself which opens a HTTP/S connection to the cloud system.
RTView visualizes the event mesh as a whole and provides drill down into a single instance of a broker to access details about message rates, connection statistics, and various other metrics.
The following screenshots shows a monitoring pane for MQTT connections of devices across the edge brokers and the message rates:
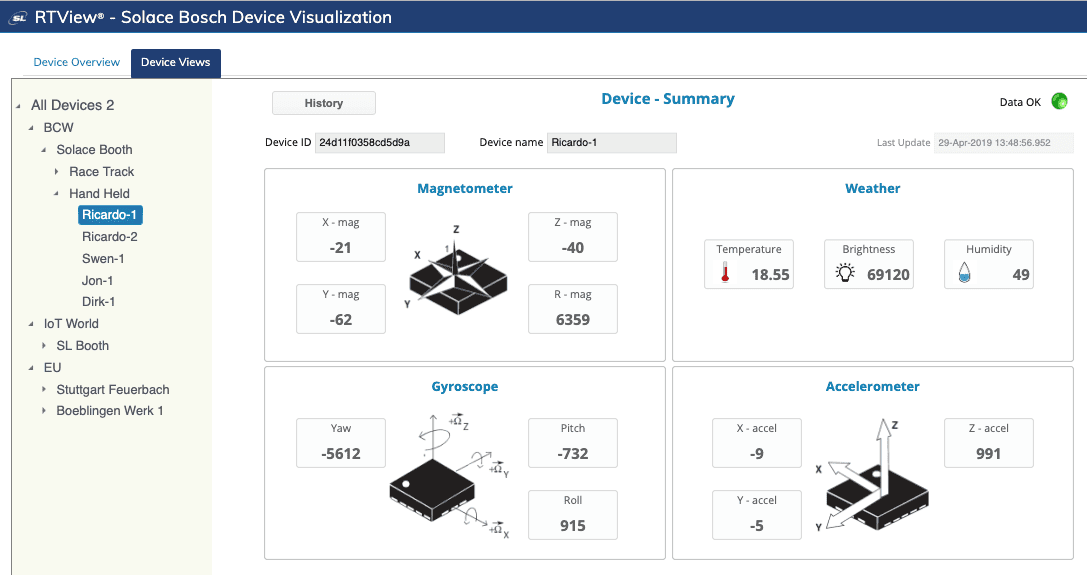
Real-Time IoT Data Visualization with SL RTView
SL RTView is a configurable and versatile tool for all kinds of data visualization. We used RTView to also implement a visualization of the real-time IoT event data published from the XDKs.
A real-time snapshot of the various sensor data from the XDK:
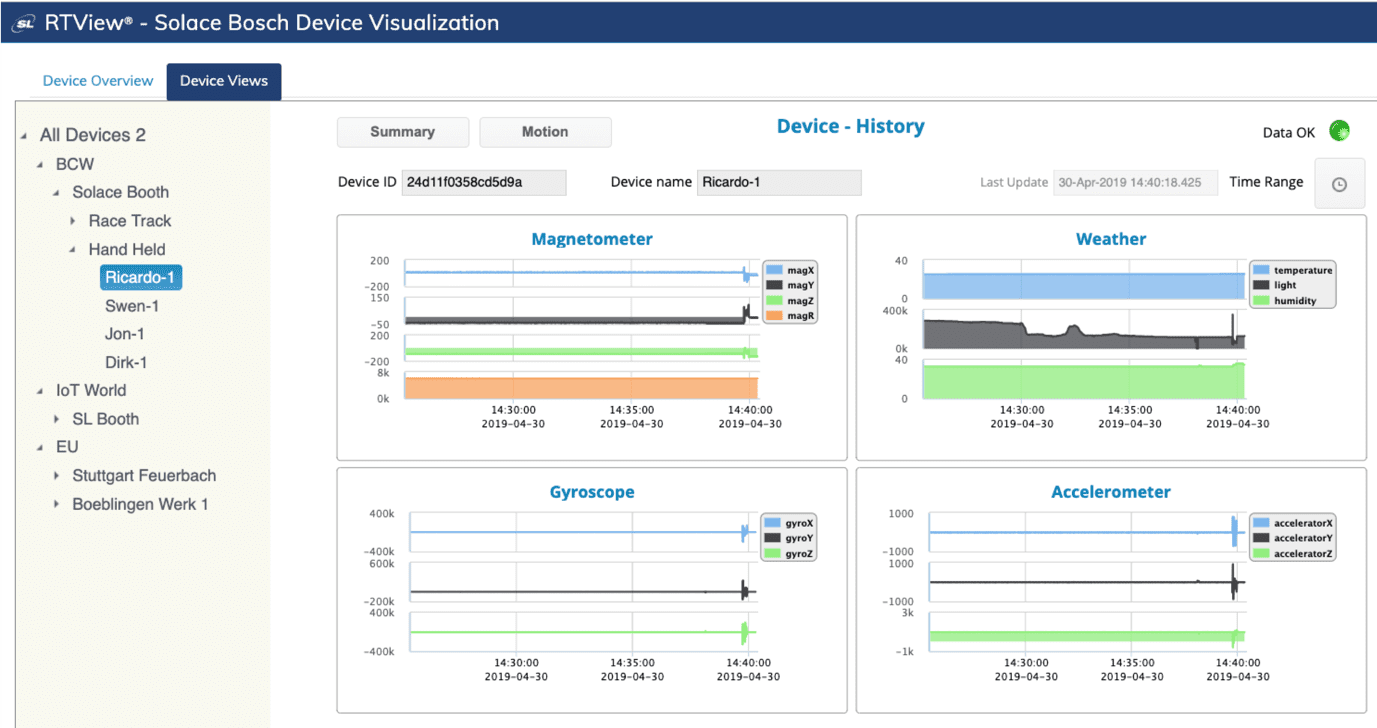
A time-series view of the XDK sensor data:
Visual Analytics with Altair Panopticon
Altair Panopticon is a streaming and visual analytics toolset. It enables users to program sophisticated business logic and data functions using a fully visual interface and publish dashboards to the web in minutes.
Panopticon can directly subscribe to Solace events and we created a set of visualization dashboards to monitor XDKs in various use cases.
Here we can see the XDK110 mounted on “slot trucks”:
In the next graph we can see a truck doing “normal” laps around the track. The gyro X and Y values are fairly low whilst the gyro Z values are more interesting. They show quite clearly how the truck races around the track, turning left and right.
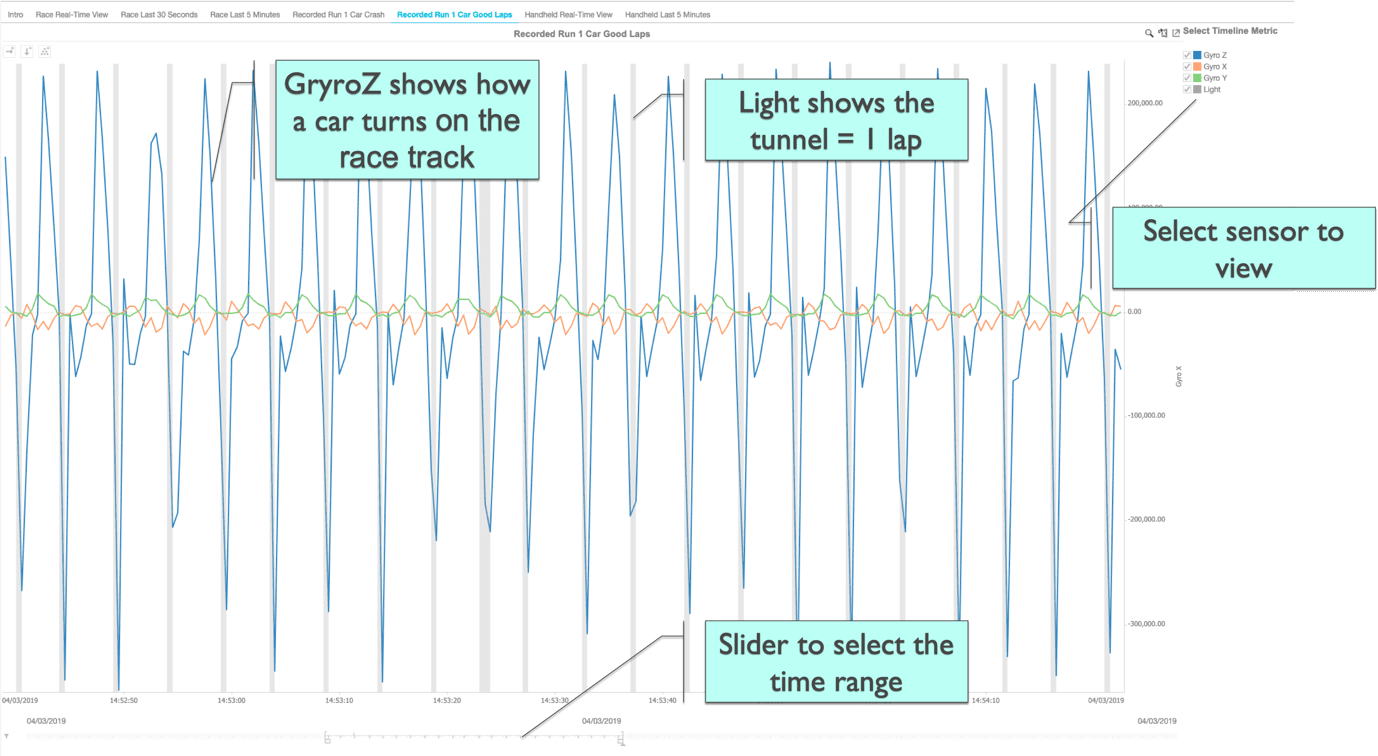
It gets interesting when we observe a truck crashing off the track. In this case, the gyro X and Y values spike, as we can see in the following screenshot:

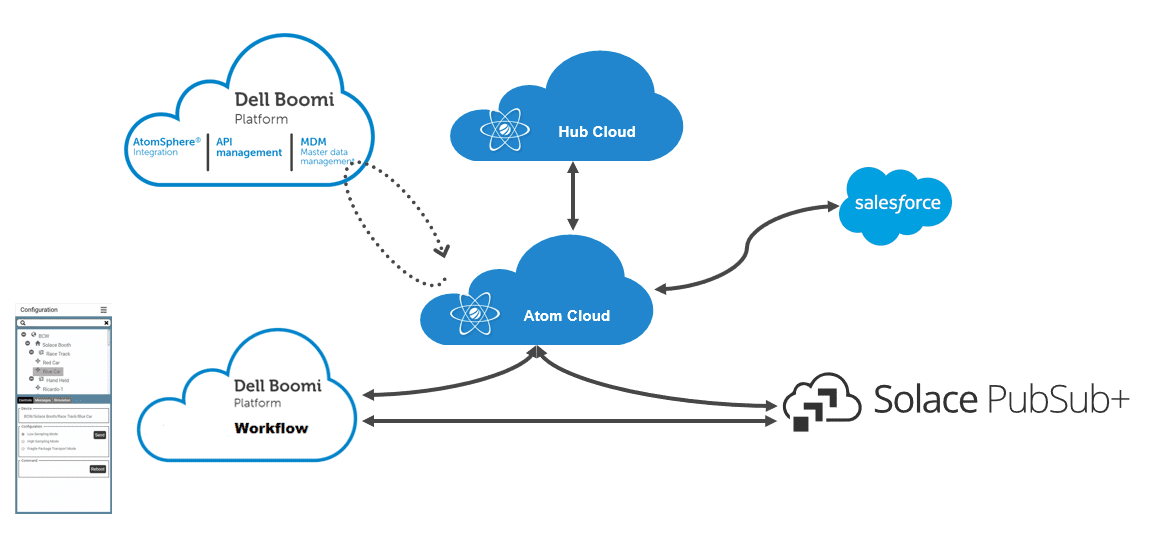
The Dell Boomi Solution Architecture
Dell Boomi provides unified iPaaS platform to create full-fledged business applications and integration solutions in a hybrid cloud environment. We have used the following modules:
- Dell Boomi Flow & Integration to realize the Profile Management application and the logic to remotely control the XDKs
- Dell Boomi Hub to manage the reference data for the XDKs – the device Ids and their respective categorization
- Dell Boomi Integration to propagate Alerts into Salesforce Service Cloud
The following picture shows the Dell Boomi solution architecture:
Integration with Salesforce was implemented using Dell Boomi Integration. The following picture shows the flow definition for this integration:
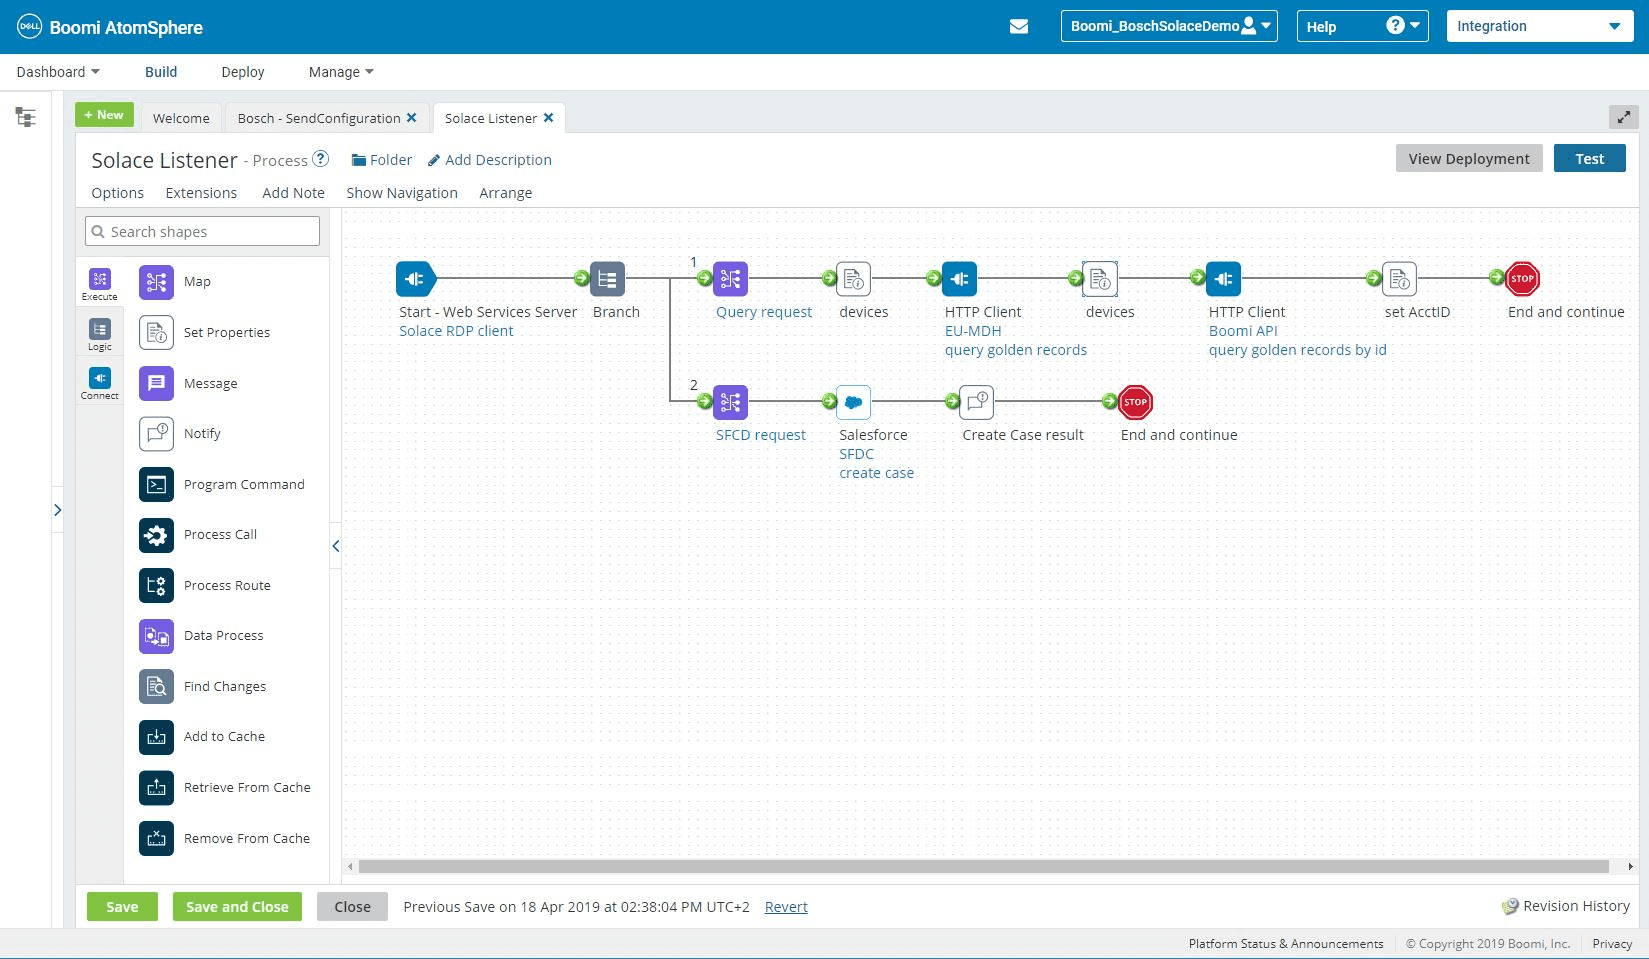
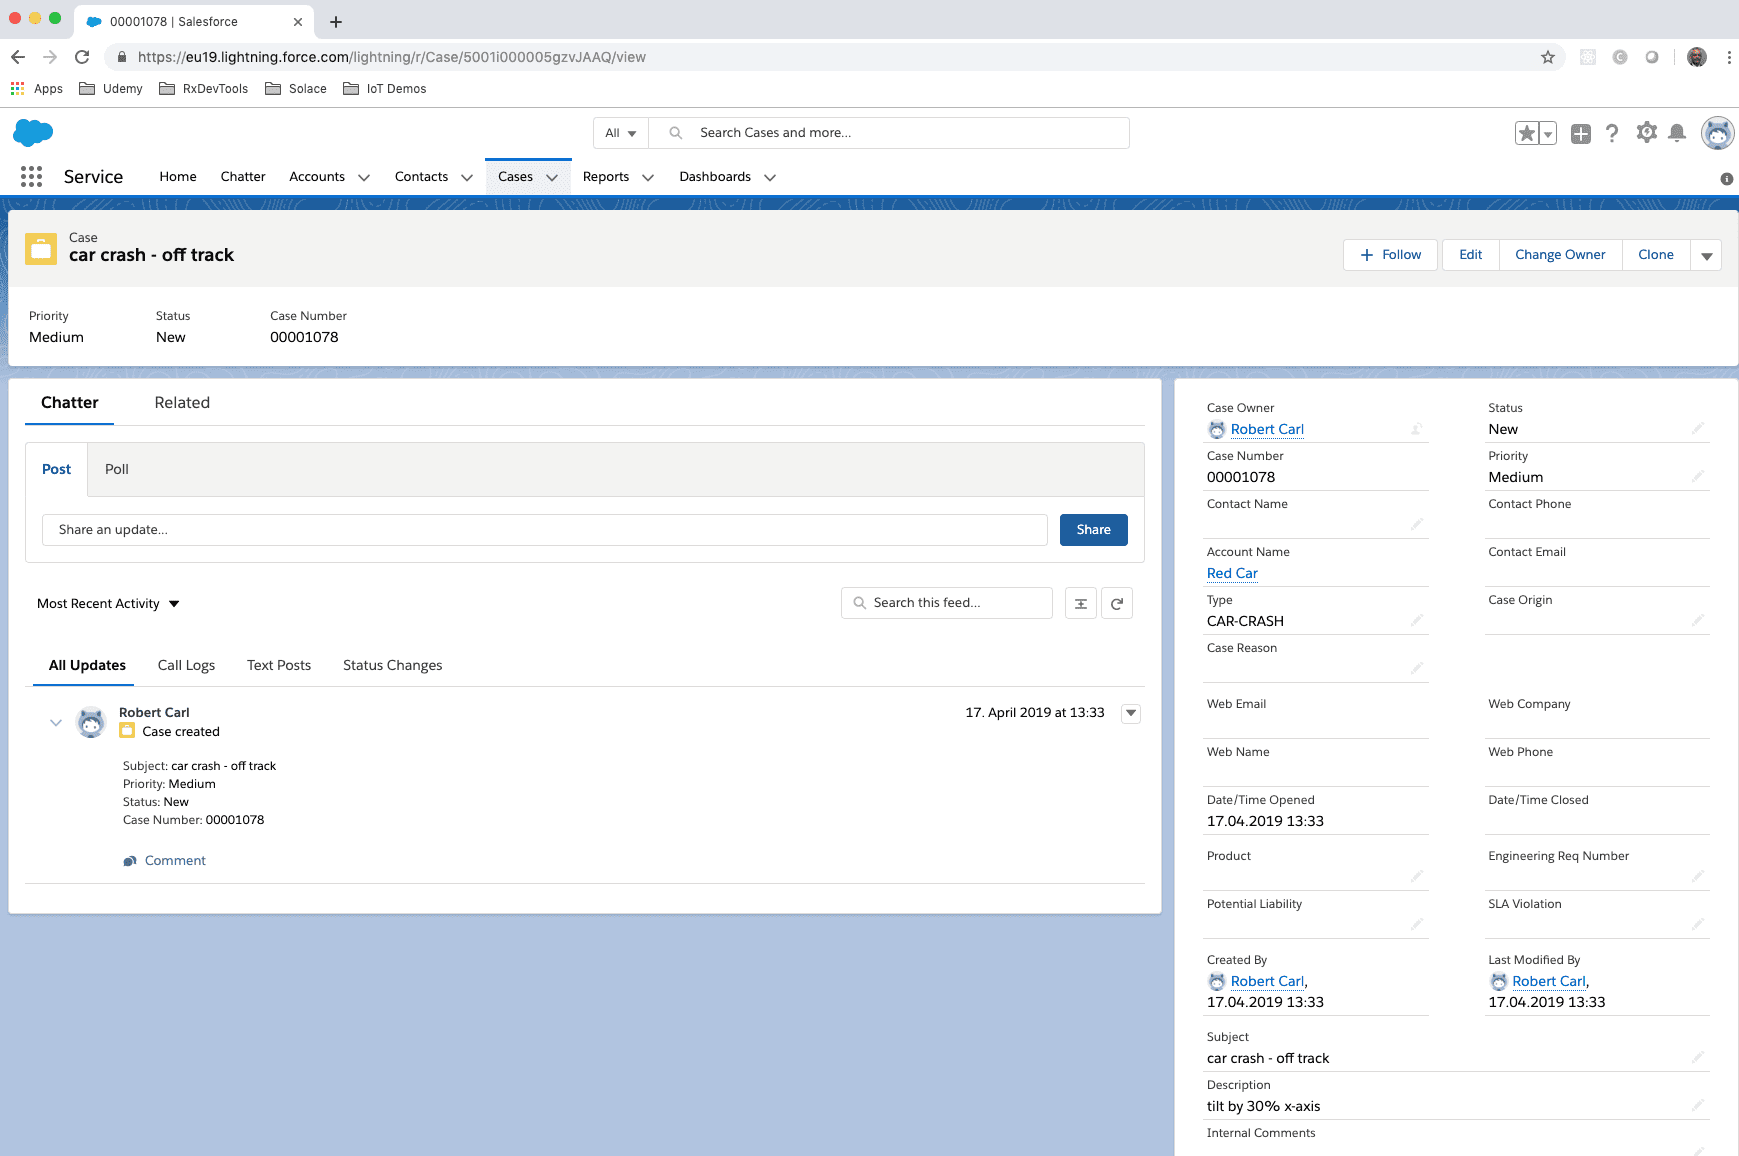
And when the streaming analytics module detects a car crash, a service case is automatically created in Salesforce:
Additional Tooling
In order to decouple the development between the various teams and for testing and simulation purposes, we needed a few basic tools: an interactive MQTT pub/sub tool and event recording and playback tool.
There are many tools out there to send and receive MQTT messages. We have chosen MQTT Box.
You can configure one or many connections to a Solace broker directly in the tool. All you need is the host, port, username, and password:

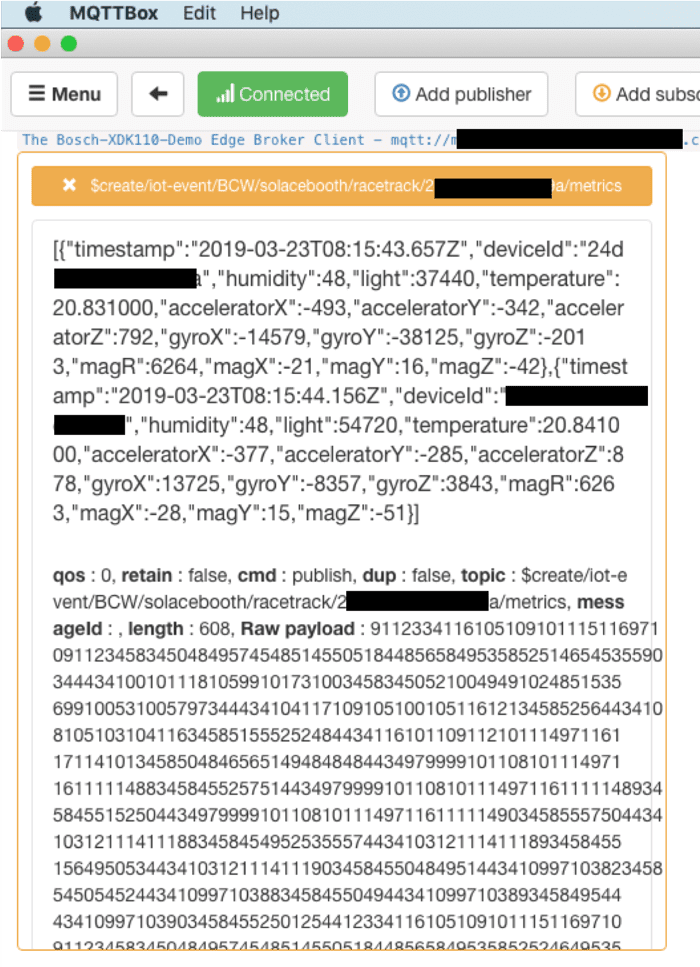
After this, you can add publishers and subscribers. Here is a screenshot of a subscriber to the metrics as sent by the XDK:
Equally, you can use a publisher to send commands and configuration messages through the event mesh to one or many XDK devices.
In order to facilitate the development of analytics and dashboards, we have also developed a simple event recorder and player. This allowed us to provide our partners with recorded data sets that they can play back at their leisure to develop and test their applications.
Conclusion
The entire project was developed over a period of about two months. We started with the implementation of the XDK application and once we understood the data and interactions that we could implement there, we created the API specifications for our partners to start working on their parts.
However, as the project evolved, so did the ideas and requirements. By having the flexibility of the event brokers as the basis for all communication and interfaces, we incrementally refined the topic structure and event payloads as required without disrupting the on-going integration and development work.
Another area that evolved over time was the requirement of where various XDKs are located and need to connect. We started with a single broker “event mesh” and over the course of the project, we added the broker on the Dell Edge Gateway as well as multiple regional edge brokers such as Ireland and US. Towards the end of the project, we also needed to integrate a home-grown analytics application running in Azure in France. This was equally seamless; we installed a new broker in Azure and created the bridge between the central broker and the new broker to feed the selected event streams to the application.
In our view, this is really the key learning from this project. In order to incrementally build business and interaction logic and add new services to the platform, the concept of an event mesh using publish/subscribe with a clear topic taxonomy was key to success.
It is obviously important to address real-world business applications in every project. However, we also need to make it interesting and fun! That is why we chose the race track as the demo system, combining both.
We would also like to thank our partners for their invaluable and timely contributions to make this project a success. And a special thanks also to the Bosch team for sponsoring and supporting this particular part of the project.
What’s next?
As you may have gathered, we completely put aside two crucial aspects of an IoT platform: Device Management and Access Control. We are currently busy working on a management interface for the event mesh that can be used by a device management platform. When provisioning new device types and individual devices, the event mesh will be automatically configured to create the authorization and access control for the new devices on their respective edge brokers as well as the bridges to connect the new data streams.
In upcoming articles, we’ll describe the details of the various APIs and also make the XDK application available on GitHub.
Stay tuned!


Subscribe to Our Blog
Get the latest trends, solutions, and insights into the event-driven future every week.
By submitting this form, you agree to Solace’s privacy policy: solace.com/privacy-policy/