
More and more companies are linking advanced event brokers to create an event mesh that dynamically routes events and information along the best possible path to make sure they get everywhere they need to be—on-prem or in the cloud, anywhere in the world, no matter what.
Problems with the brokers that make up such an event mesh—or other issues that those event brokers can help you identify—can have far-reaching effects on your applications, your users and your bottom line. That makes it critical that you put in place a system that lets you proactively identify and address developing situations before they become problems.
How and why you need to proactively monitor your event mesh
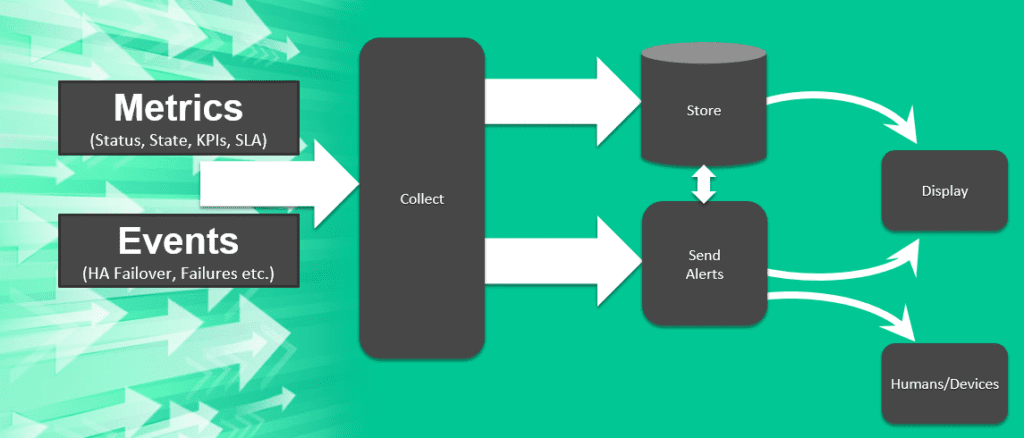
The monitoring of your brokers starts with collecting metrics and events, storing them, making them available for analysis via dashboards, and sending alerts so people and systems can take necessary action.
Effectively addressing these requirements pays off in several ways:
- Proactively address broker, network and application/client issues before they cause problems
- Identify trends and insights you can use to improve the user experience
- Optimize the performance and capacity planning of your system
What you monitor matters
Some companies monitor metrics, and some monitor events. What’s the difference? Metrics are a measurement or statistic at a point in time for the system, usually collected at fixed time intervals. A metric can have a value, timestamp, and identifier of what that value applies to, such as a source or a tag. An event, in monitoring lingo, is an autonomous notification sent from a device or system (a syslog entry, for example, is generated and received any time something happens). For a complete view of what’s happening or causing issues in your event mesh, you need to monitor both metrics and events.
For example, say you need to debug code and troubleshoot an outage. Debug logs, stack traces, and commits will help, but only by looking at broker-generated events will you be able to see how it runs once it’s under a real load, let alone get alerted when a problem occurs or is about to occur. Metrics can tell you when your system began raising in resource utilization, and you can use that timing data to see that you also had a commit seconds before, which broke a service and brought down other services.
The desire to help customers realize these benefits drove the development of PubSub+ Monitor, a product that lets you more effectively monitor and manage your PubSub+ based event mesh. PubSub+ Monitor was developed in conjunction with monitoring specialist SL Corporation, which has been a strategic partner of Solace’s for many years.
Meet PubSub+ Monitor
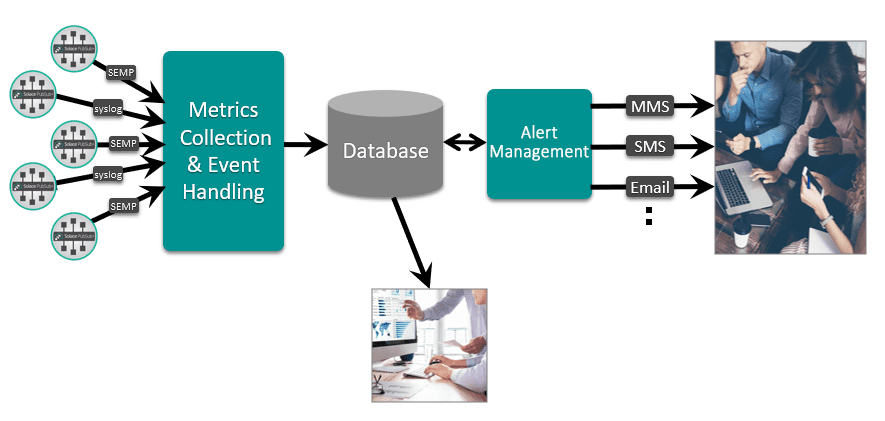
Solace PubSub+ Monitor is not just another monitoring product. It collects both critical metrics and events generated by your system, then uses alerts and dashboards to notify your IT staff so that they can proactively address issues before they affect your operations and customers. PubSub+ Monitor provides metrics and events information at the system, service and client levels to make your job easier.
And Monitor also features an “agentless” architecture so it’s easy to deploy and upgrade, and it lets you monitor all of your software and hardware brokers.
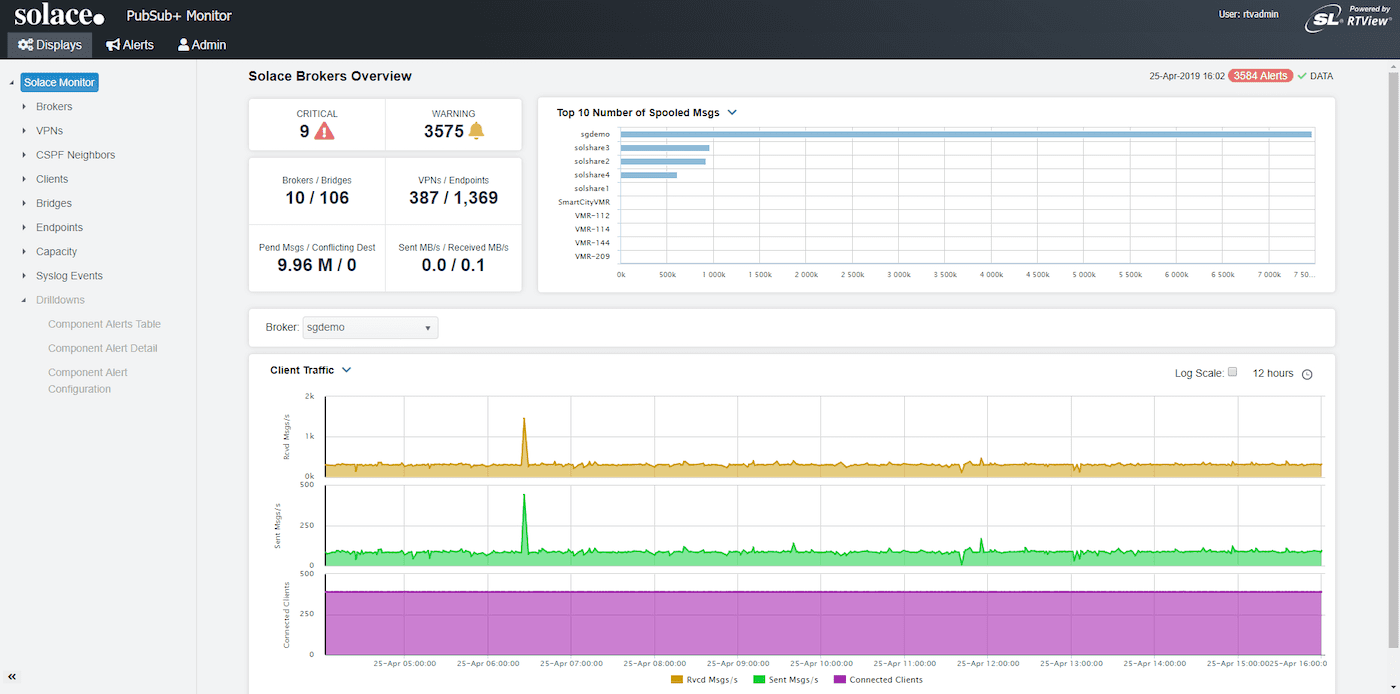
Dynamic real-time dashboards
PubSub+ Monitor provides pre-configured dashboards that you can view on almost any device, and that give you rich visibility—both real-time and historical—into key metrics and events.
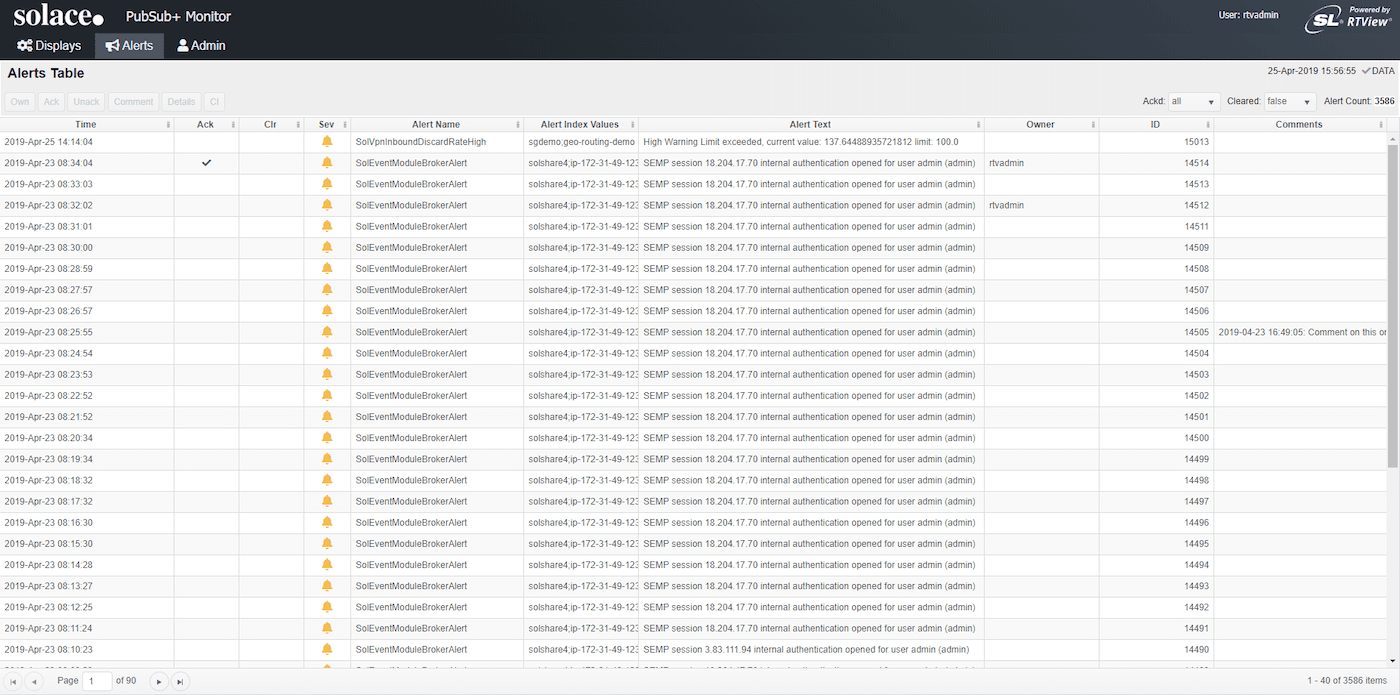
Actionable alerts
Monitor sends alerts based on pre-defined or custom thresholds, and lets your IT staff drill down to examine and address the situation behind them.
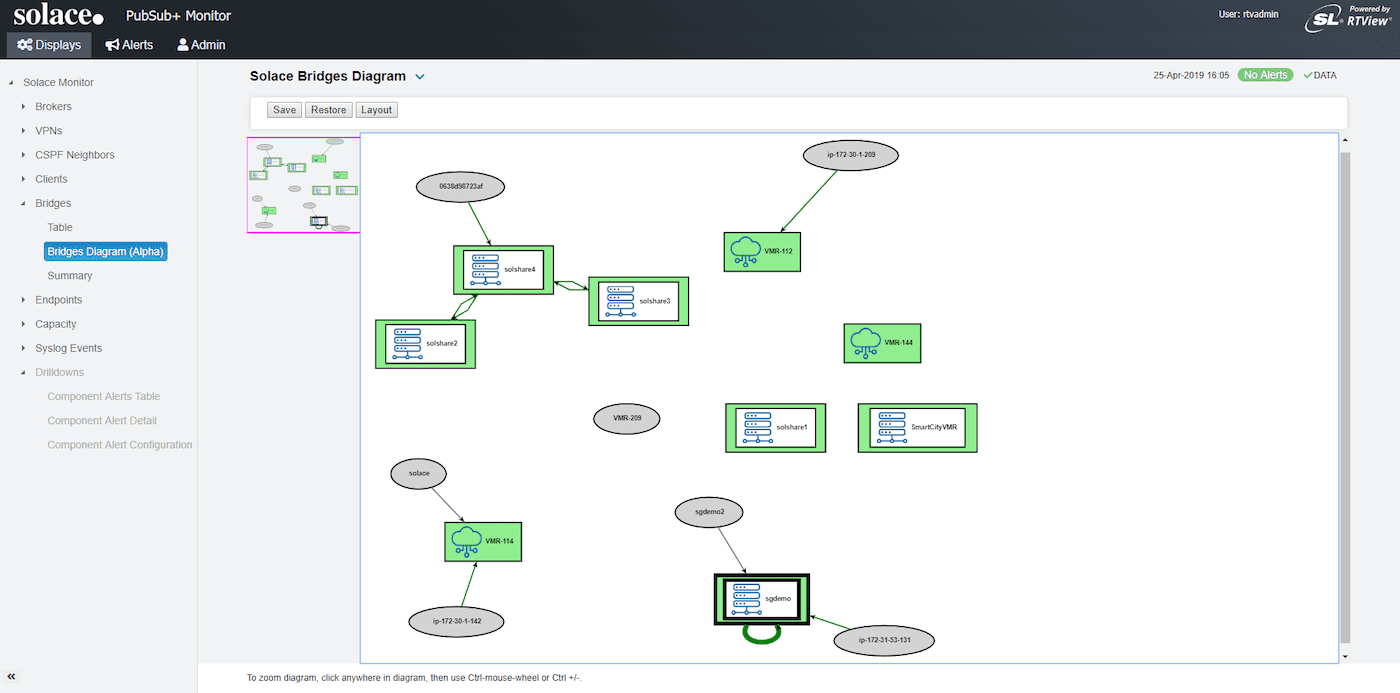
Visual view of your event mesh
Lastly, PubSub+ Monitor gives you a logical map of all of your event brokers—software and hardware—so you can pan and zoom to check things out at a high level or drill down to see what’s going on with individual brokers. You can even click an element to launch PubSub+ Broker Manager so you can manage a specific broker via its nodal management console.
Conclusion
By enabling more effective monitoring of your PubSub+ based event mesh, PubSub+ Monitor can make your hybrid cloud infrastructure more reliable and robust so it better meets the needs of your business and customers. To learn more, visit the PubSub+ Monitor product page or contact us.


Subscribe to Our Blog
Get the latest trends, solutions, and insights into the event-driven future every week.
By submitting this form, you agree to Solace’s privacy policy: solace.com/privacy-policy/