
One of the most useful features of PubSub+ Event Portal for modeling event-driven applications is the ability to discover, catalog and visualize your runtime. We know this because enterprise architects with Apache Kafka deployments have been wowed by this tool’s unique ability to give them visibility into their Kafka event streams – something they had been lacking. Firsthand feedback confirmed that they weren’t originally able to easily visualize which applications were consuming what topics. While this was great feedback from architects with Kafka deployments, most enterprises have multiple broker types in their environment, so to get full visibility of their event-driven environment they need the ability to discover all event streams – not just the ones running through Kafka brokers!
Introducing Runtime Discovery for Solace Brokers
Today, PubSub+ Event Portal added support for discovery from PubSub+ event brokers so that architects can hit the ground running as they migrate more and more of their systems to an event-driven architecture. For the first time, enterprises can start by discovering their existing architecture running over Solace brokers and evolve their design from there!
PubSub+ Event Portal users can avoid the laborious work of entering their designs into a static tool (i.e., Microsoft Excel, Confluence, PowerPoint, Visio, etc.) which quickly gets stale and nobody else across the department, company, or externally can reuse to design new applications and systems to serve their customers.
For the first time, enterprise architects and middleware managers can see exactly what events are being consumed by what applications and what published data isn’t being used at all! This kind of insight allows you to optimize your infrastructure and become proactive instead of reactive.
A Guide for Discovering Your Existing EDA in Runtime
In the video below, I show the five simple steps to discover, catalog, and visualize your existing runtime event-driven architecture. I will also cover the steps below if you prefer reading to watching 😊.
Step 1: Scan a broker with a locally deployable discovery agent
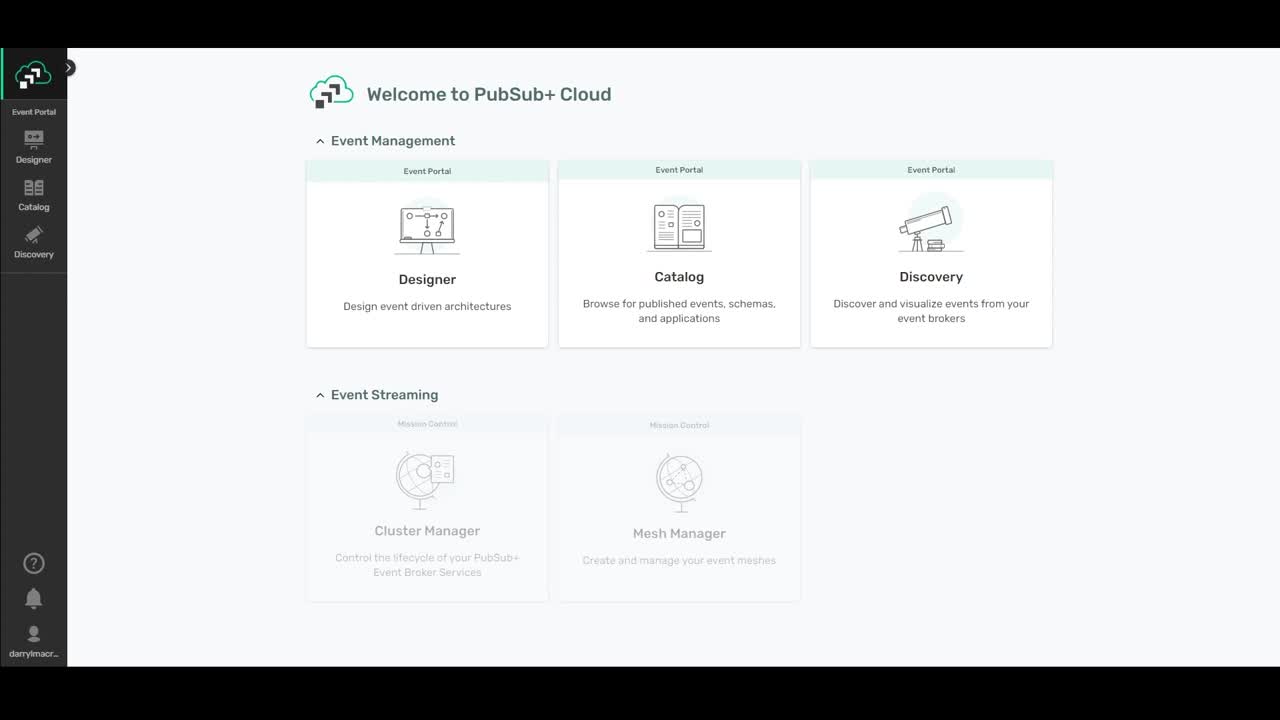
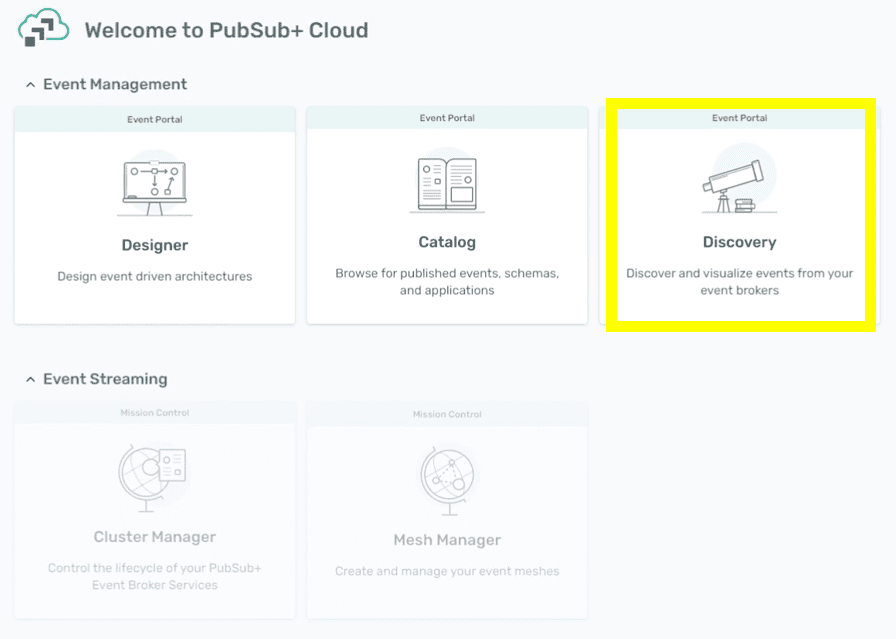
I’ll be using the “Discovery” part of PubSub+ Event Portal to download the discovery agent and scan my broker for topics, queues, clients, subscriptions and their relationships.
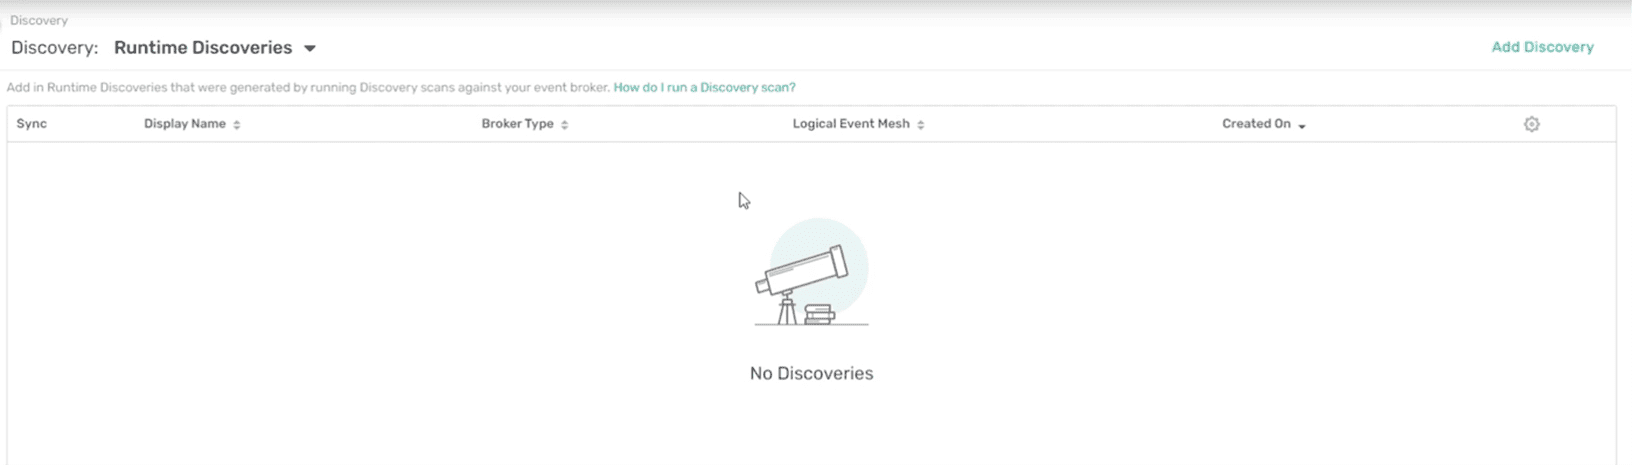
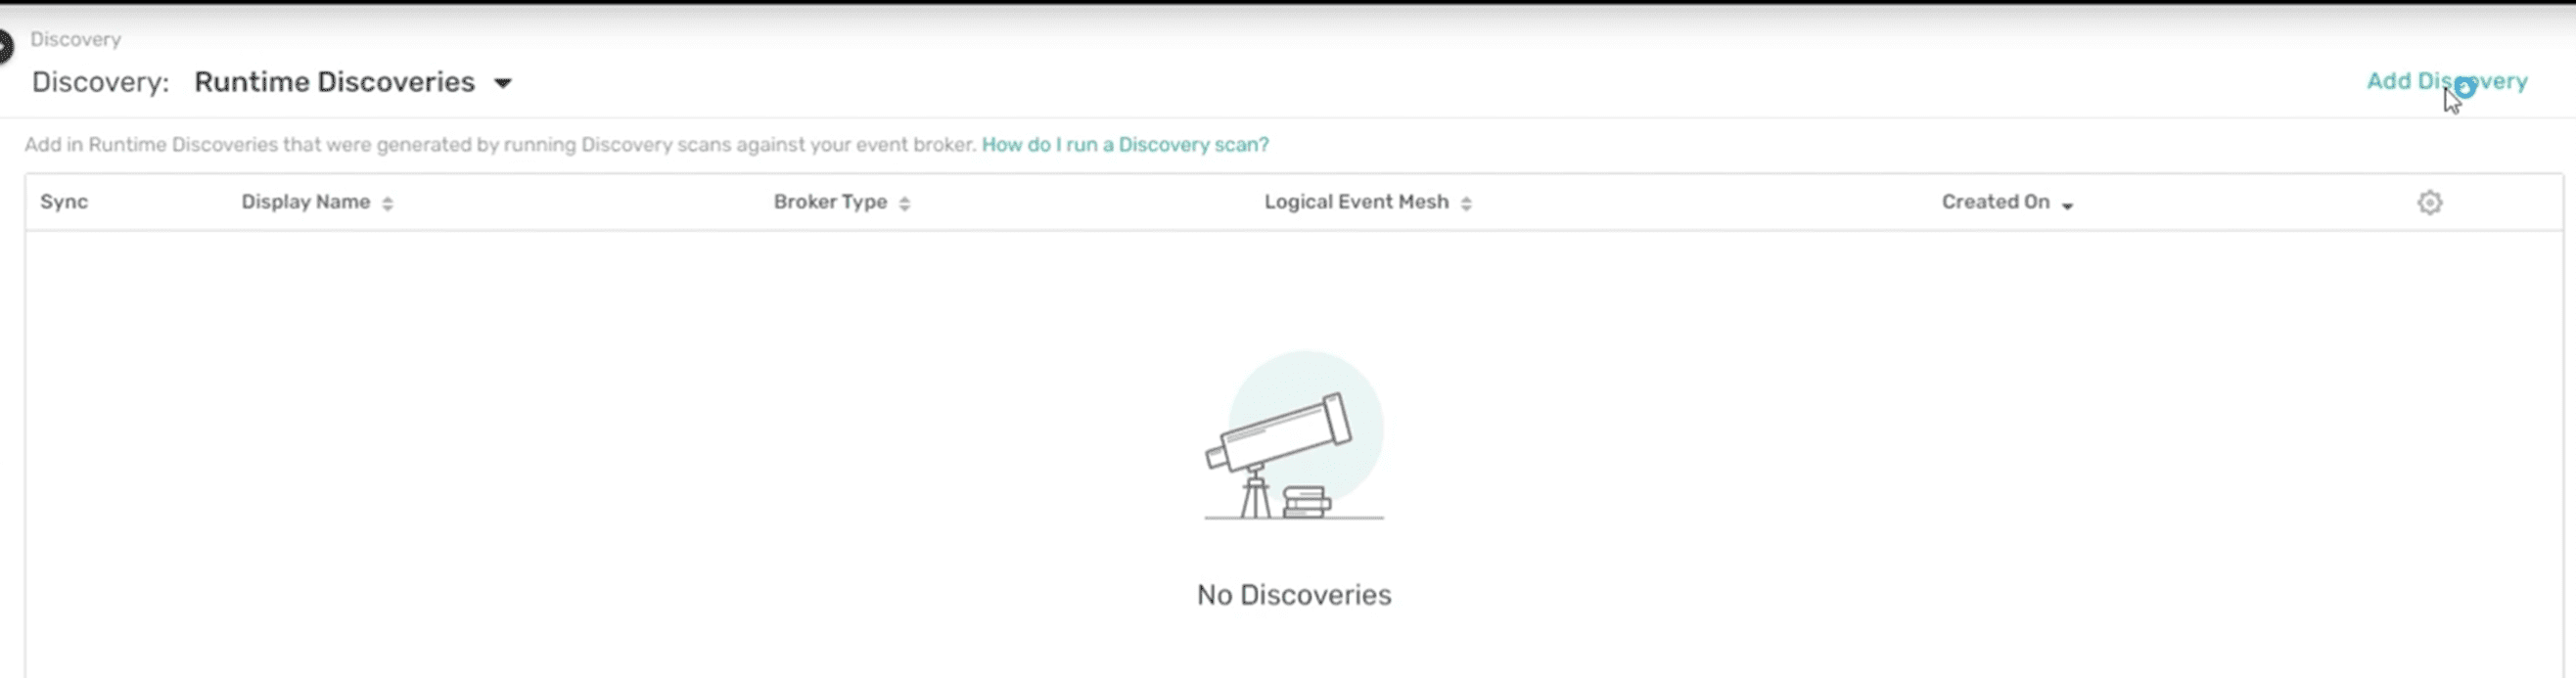
As you can see from the image below, there are currently no discoveries. Once I download and install a discovery agent, I’ll be able to run a discovery scan.
The discovery agent is available as a docker container or binary executable. Once you have installed it, you can access the UI via http://localhost:8120 and run the scan against your event broker, like so:

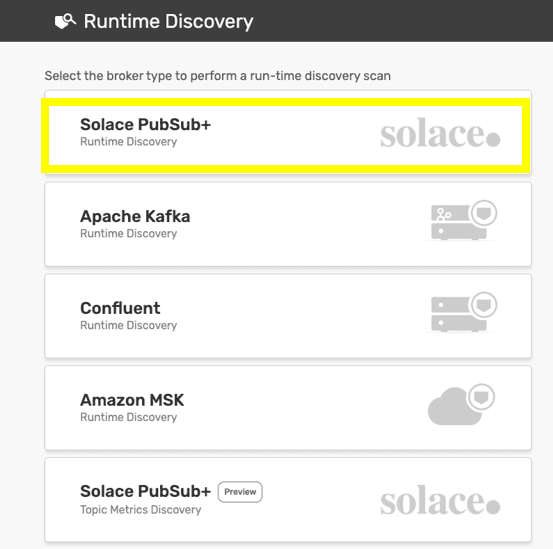
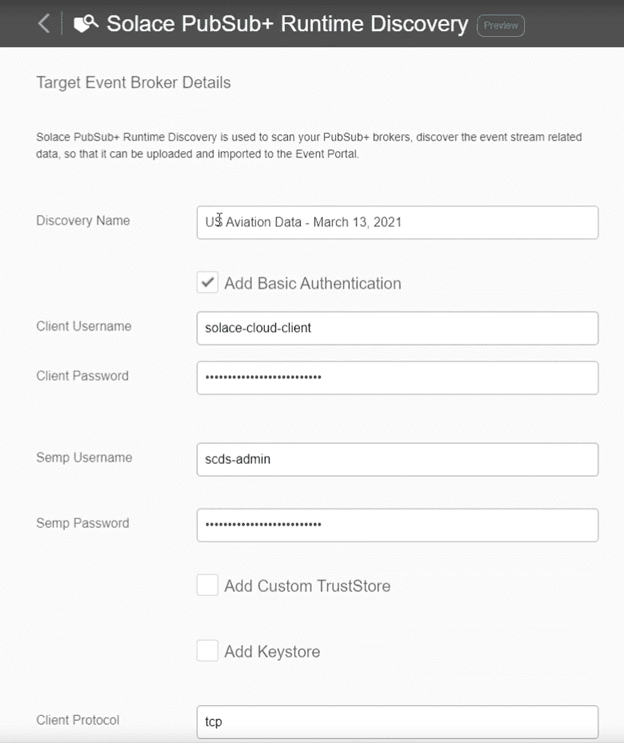
I can then select the broker type (Solace PubSub+, in this case) to perform the discovery scan. Note: you can do the same thing with the Kafka brokers to discover event driven architecture components from that broker type as well.
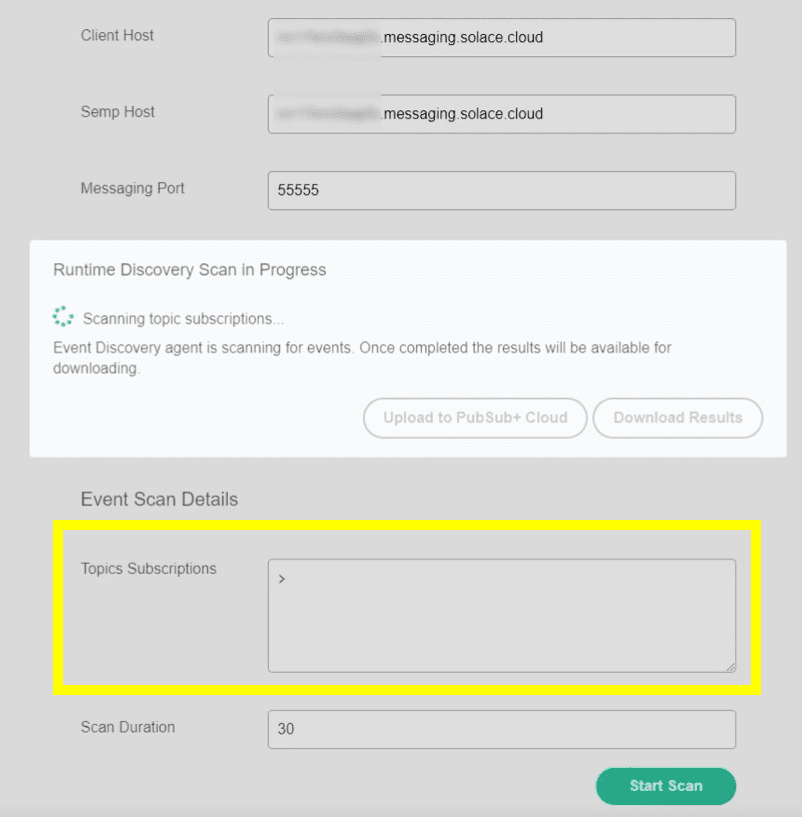
Then I give the discovery a name and enter the connection details of the broker that I’m running the scan against. In this case, I’m running it against a broker with US Aviation data being published to it. You can specify the topic subscriptions to attract a subset of or the entire topic hierarchy, as well as your scan duration. In this example, I’m discovering all published topics during a 30 second interval.
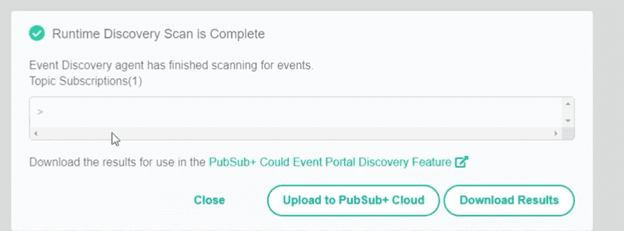
Once the resulting JSON file is downloaded locally, I’m ready to move to Step 2. As you can probably tell, this only took a few minutes. I could have chosen to upload the file directly to the Event Portal in PubSub+ Cloud as well which would have saved me from performing the first part of Step 2.
Step 2: Upload the discovery file to PubSub+ Event Portal
Now I’m ready to select “Add Discovery” to PubSub+ Event Portal from my desktop:
It can take up to a minute or so to upload the file depending on its size. This file contains all the topics, queues, client usernames, subscriptions, and their relationships that I’m discovering in this example. Once the file has been uploaded, you notice that there is a column for a “Logical Event Mesh” (LEM). It represents the Message VPNs or the mesh of Message VPNs that the discovery agent scanned.
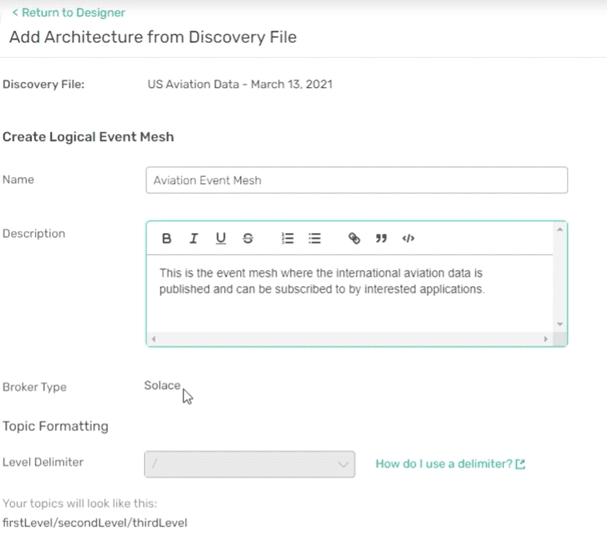
I then select “Import to Designer” and assign it an LEM.
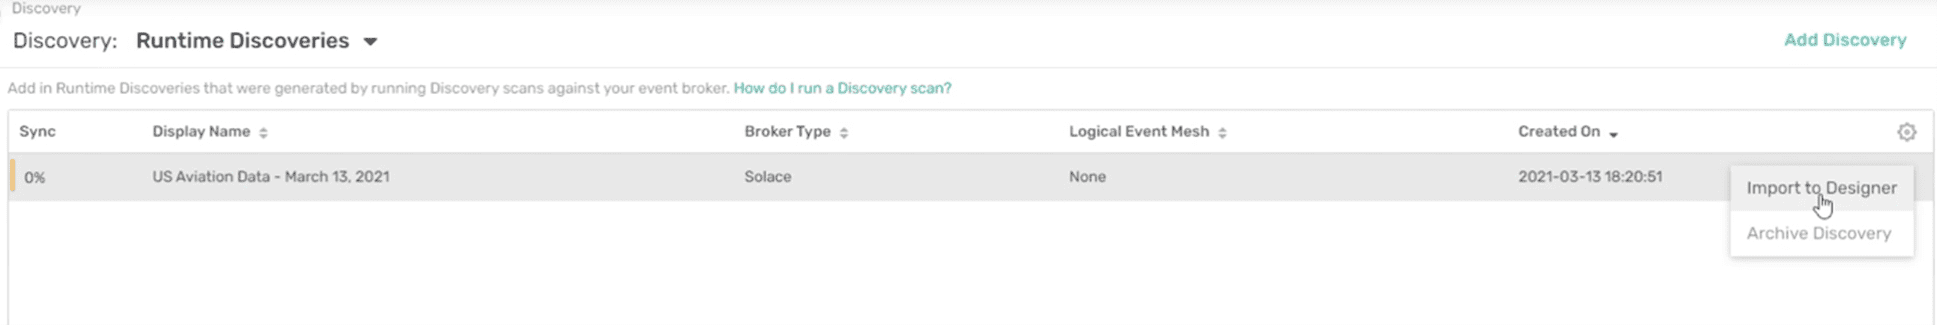
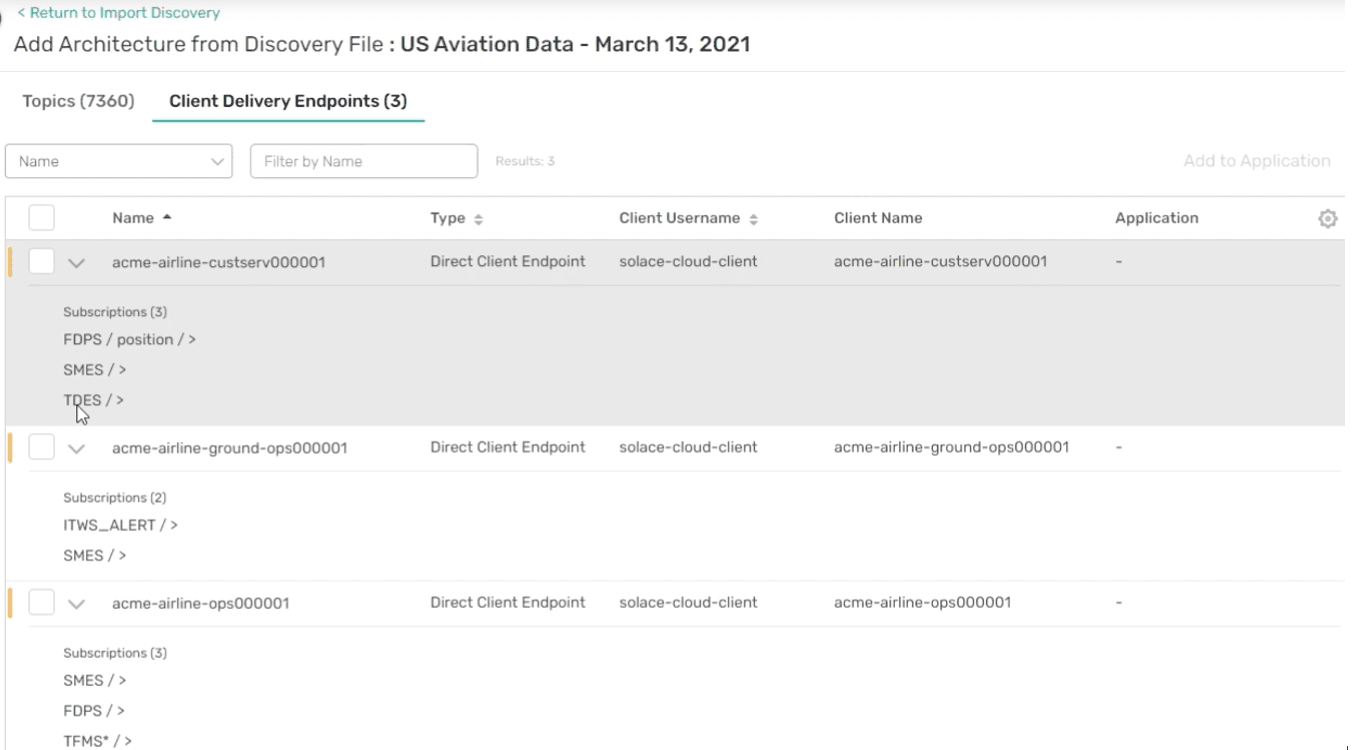
At this point, you can see what was discovered: 7360 topics and 3 client delivery endpoints (CDE). For Solace brokers, a CDE represents an event queue, a durable topic endpoint, or a direct client connection with associated subscriptions for a direct messaging class of service.
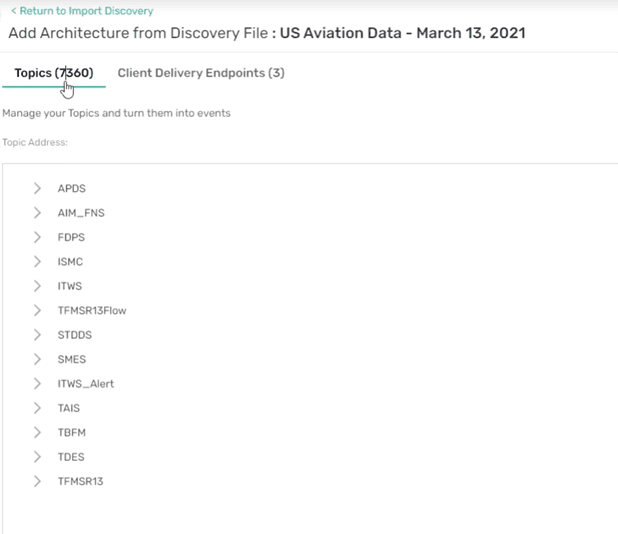
It’s no surprise that this discovery file is huge because I ran it for all topics and therefore the scope is all US aviation event data, including surface movement event data, flight position update events, weather system data, and a whole lot more. In the next step I’ll make sense of all these topics with the topic level compression tool.
Step 3: Compress individual topics down to dynamic topic addresses using the GUI
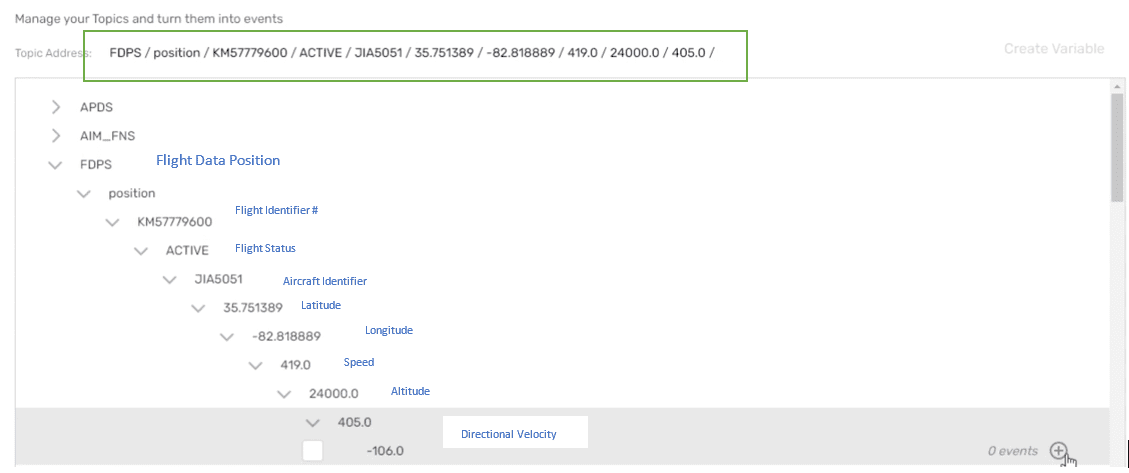
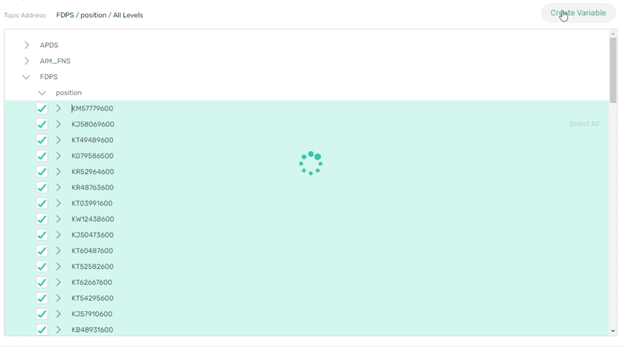
The discovered topics for each event instance captured during the discovery scan are shown in a topic tree structure. If I drill all the way down into a section of the tree, you’ll see the different topic levels that make up an individual event instance. In the screenshot below this is a flight position data update event instance which includes topic levels for flight identification number, flight status, aircraft identifier, latitude, longitude, speed, altitude, and directional velocity. The literal values are what’s shown because the publishing application replaced the variables in an event type’s topic address with specific values at runtime.
My task here is to represent large numbers of these event instance topics as an event type topic address with variables representing the values at the appropriate topic levels. I then create an event type for that compressed topic address.
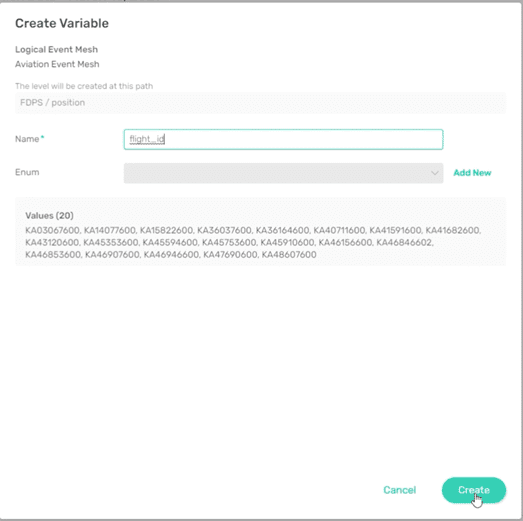
Using the compression tool, I create a variable for the position level by selecting all the literal values for flight identifier and click on “Create Variable”.
I’ll call it flight_id and select “Create”. It takes a moment to compress these values into the variable because there’s over 3000 of them.
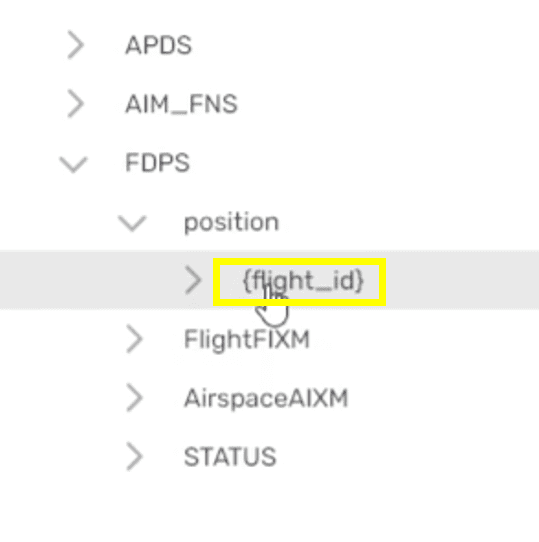
After compression, the literal values are now shown as a variable called {flight_id}.
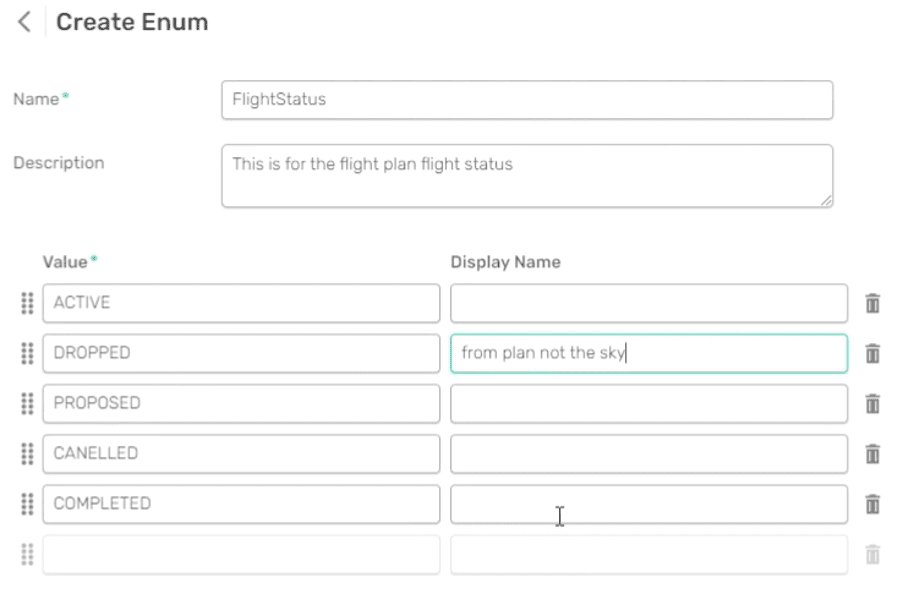
Similarly, if I drill one more level down, I can compress the flight status literals – “Active”, “Proposed”, and “Dropped” into a variable called flight_status with a specific value set. We called this type of variable an Enum because it has an enumerated set of valid values.
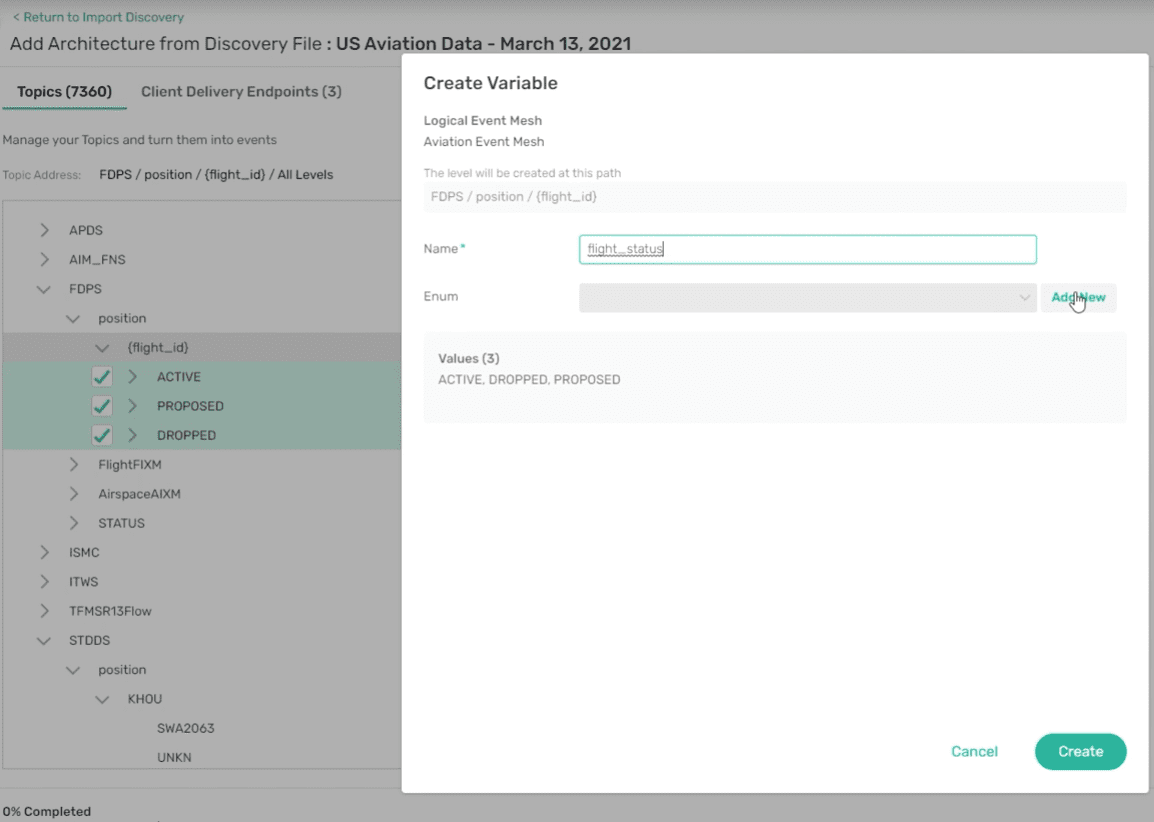
I can also add values to the Enum variable – “Cancelled” and “Completed” – that may not have captured during the discovery scan but that I know about, as well as add descriptions to help other architects and developers filter the event data streams they want to attract to future applications that may need to reuse this event type via specific subscriptions.
Once I finish compressing the topic levels for the event type to be created, you can see the new topic address:
FDPS/position/{flight_id}/{flight_status}/{callsign}/{lat}/{long}/{speed}/{alt}/{x-component_velocity}/{y-component_velocity}
You could do this for all discovered topics until all are represented by topic addresses for the associated new event types or you could come back and finish this later.
I’m now ready to import and organize this data within the Designer part of the tool.
Step 4: Organize discovered data within Designer
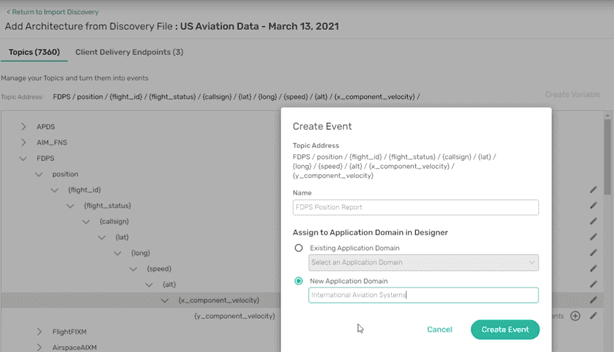
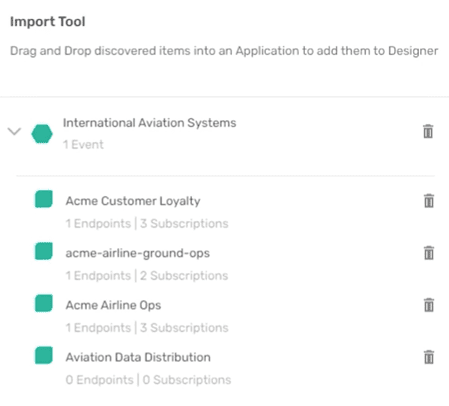
I’ll name this particular event “FDPS Position Report” and assign it to an application domain in Designer called International Aviation Systems. There is now one event in this new application domain.
Next, I determine what my applications should be from the three client delivery endpoints (CDE) discovered and shown below. Here you can see an airline customer service CDE that would be for an associated application that’s interested in the flight position data so that it can dispatch a car to pick up VIP passengers on time. You can also see the other two CDEs – Airline Ground Ops and Airline Ops which would map to the associated applications that are using them to attract the data each are interested in using.
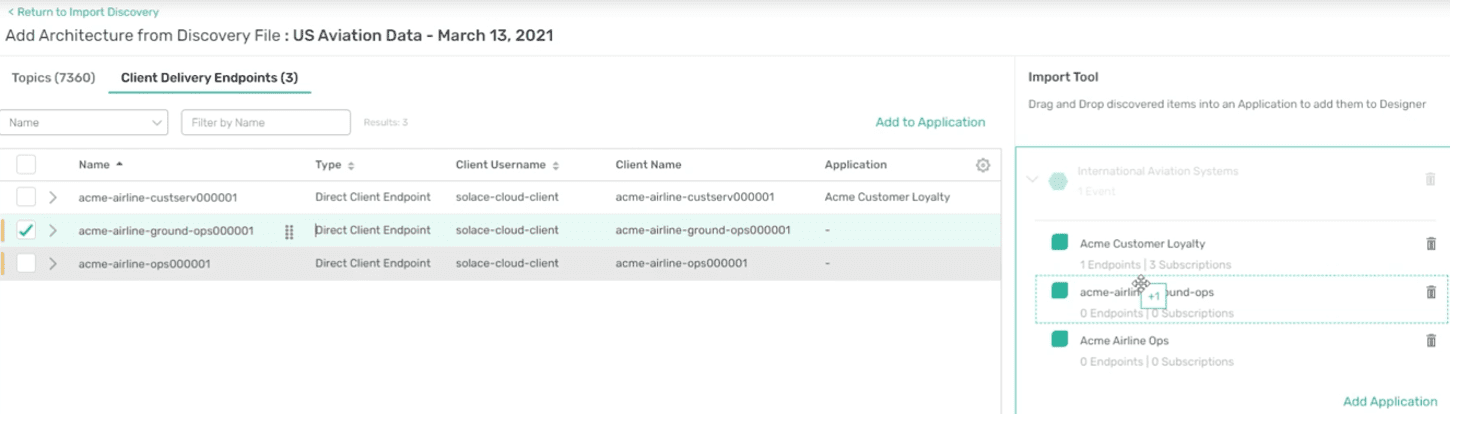
To map these CDEs to applications, I select “Add Application” and give them names.

I can now easily map these CDEs and their subscriptions to each application using the drag-and-drop capability:
I can also create a fourth application (Aviation Data Distribution) to publish these discovered events. At this point, I have one new application domain with four applications and one event.
Now we’re done importing and organizing our discovered data into Designer and Catalog.
Step 5: Visualize your discovered event streams in a graphical diagram
Now that I’ve completed the discovering and organizing the runtime data, I can see it all in a graphical view. No other tool has the ability to do this in one place:
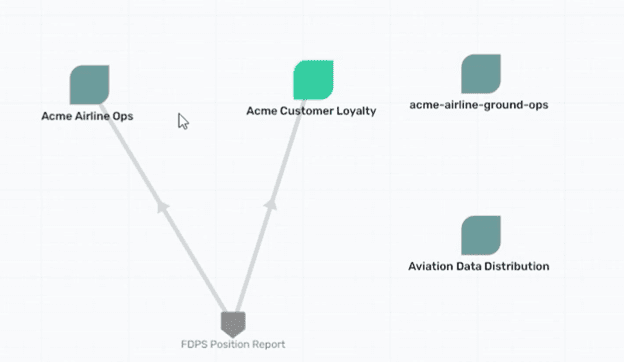
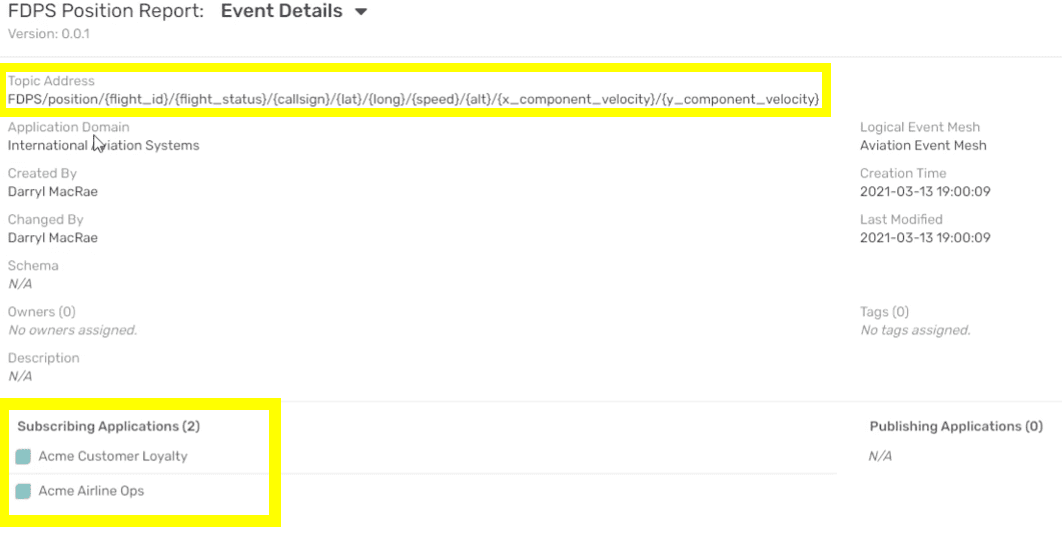
Two of my applications – “Airline Ops” and “Customer Loyalty” – are already attracting the one event type: FDPS Position Report – that I created. When you drill into the event, you can see the topic address and what the subscribing applications are.
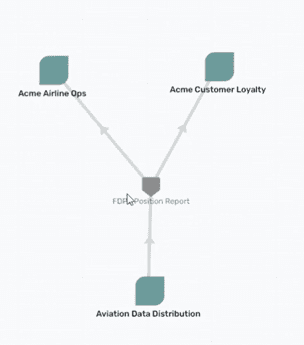
As the architect, I know that all the data is coming from the “Aviation Data Distribution” application so I can edit the application to publish the FDPS event and now I have my topology in the graph view:
In Summary
I hope that you can see how much time and effort PubSub+ Event Portal saves. Without this tool, architects would have to enter all of this information manually.
Another cool feature that saves time and allows other users the ability to browse for available events is the Catalog. It is now populated with the discovered data, so other architects and developers can search it to find event data that they can reuse to design new applications to create new services to add business value.
Don’t forget, you can do all of this with Kafka brokers now too. And we’ve built the discovery agent and Event Portal data model to be pluggable and extensible to provide these same capabilities for other broker types in the future too!
If you’re interested in trying it out for yourself, you can sign up here for a free trial. Happy designing!


Subscribe to Our Blog
Get the latest trends, solutions, and insights into the event-driven future every week.
By submitting this form, you agree to Solace’s privacy policy: solace.com/privacy-policy/