Note: If you’re a visual learner, you can watch this video to see the capabilities described below in action.
Executive Summary
Event-driven architecture (EDA) offers agility by making enterprise-wide real time data faster, more resilient and more efficient. This applies for both production workloads and for the activities of the developers and middleware teams that build and manage them.
However, EDA does make governance and observability more complex because the event flows you deploy are decoupled, can fanout to many subscribers, are asynchronous and open for governed use across teams and business units.
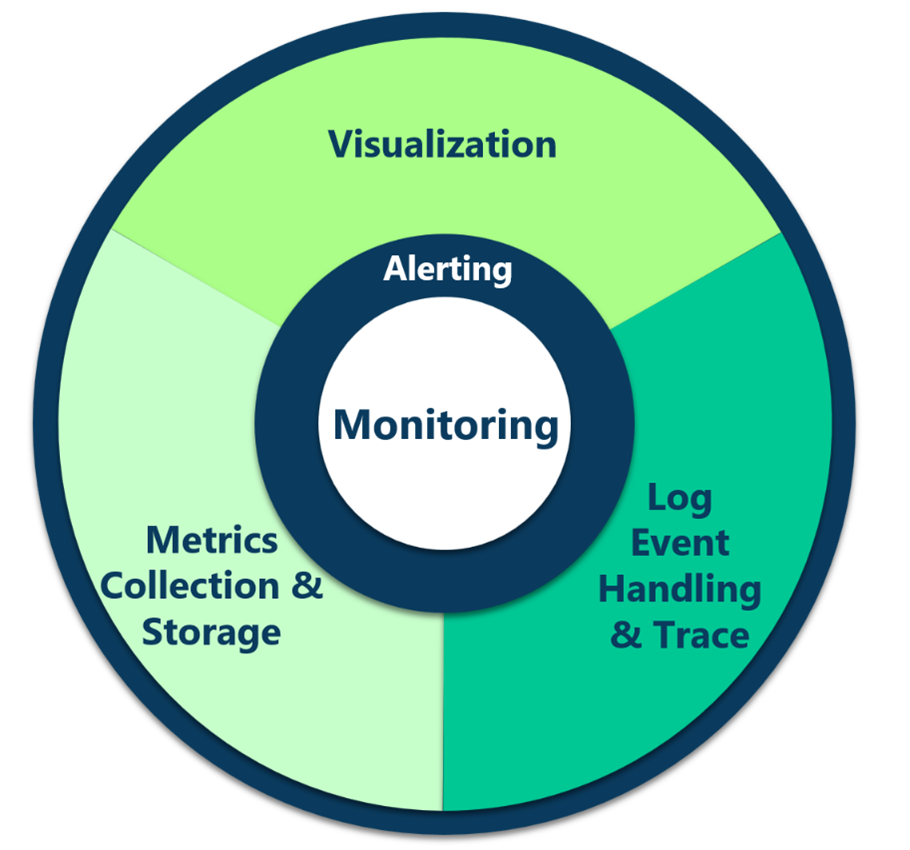
Telemetry is comprised of logs, metrics, and traces – but full observability in Solace Platform includes monitors, alerts, and visualization to deliver the entire solution.
Traditional monitoring systems (logs and metrics) that are forwarded from the data movement layer create blind spots, leading to prolonged mean time to detect and resolve (MTTD/MTTR) issues. Traces introduced a solution that is incomplete in decoupled architecture because it lacks crucial end-to-end context – “end-to-end is not point-to-point” in real-time event driven integrations.
This is especially true with the latest AI-driven applications where LLMs enable business users to build applications that consume events and where LLMs themselves are orchestrating data (aka Agentic AI) independent from architects and coders. The very openness of an excellent event driven architectural pattern has the potential to create an observability nightmare.
While an event mesh is a highly structured pattern that solves the spaghettificatoin of connectivity inherent in P2P applications, it trades off direct line telemetry because data flows based on need and performance and efficiency optimized routing across regions and withing local clusters.
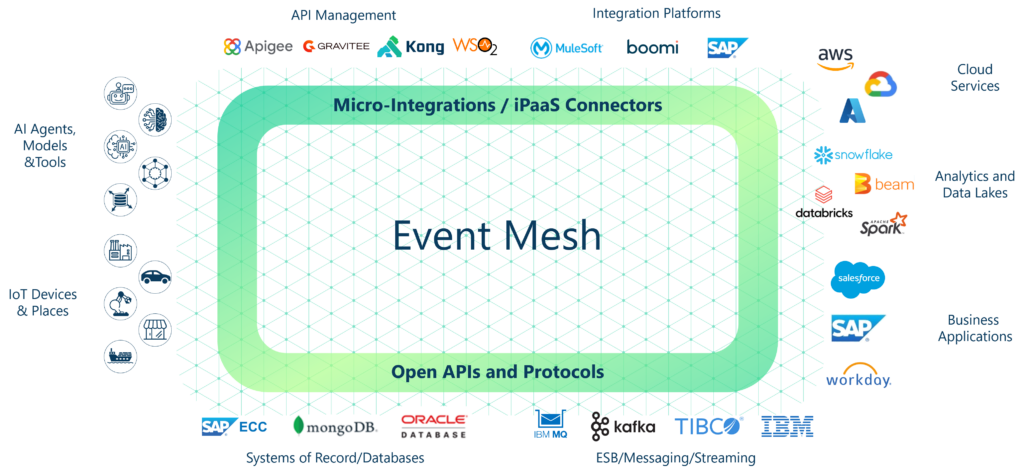
While an event mesh is a highly structured pattern that solves the spaghettificatoin of connectivity inherent in P2P applications, it trades off direct line telemetry because data flows based on need and performance and efficiency optimized routing across regions and withing local clusters.
The solution is to take a platform approach rather than a tools approach to observability because the platform ensures that the solution is integrated. Solace Insights delivers a unified observability solution natively in Solace Platform.
This shift delivers three key competitive advantages that make it the most complete solution on the market for real-time data movement at production scale:
- Full End-to-End Context Propagation: Distributed Tracing from publisher application to subscriber application using OpenTelemetry standard so every event can be tracked hop-to-hop to identify opportunities to reduce costs or improve performance (or both) while also meeting the required standards for data governance. This includes across native connections and micro-integrations that operate (and scale) independently at the edge.
- Platform-Wide Telemetry: Unified data ingestion from all broker form factors (Appliance, Software, Cloud) to ensure all logs, metrics, and traces can be visualized and managed for a complete and cohesive view. This includes deployments that combine cloud managed event broker services and self-managed event brokers.
- Open Integration: The complete solution delivers an observability back-end that delivers dashboards and alerts designed for event driven architectures, it also supports seamless data export to support existing enterprise investments in other APM stacks (i.e. Splunk, Dynatrace, etc.) that may be deployed in their operations or security centers.
The End-to-End Visibility Gap: Why Fragmented Observability Fails EDA
As organizations adopt EDA to support real-time operations and AI-powered workflows, traditional observability approaches start to break down. Point-to-point tracing was never designed for asynchronous, brokered environments—leaving teams with critical visibility gaps just when system complexity is accelerating.
- Decoupling blindness — Services are intentionally decoupled through the event mesh, but traditional APM visibility stops at the broker boundary. This makes it difficult to determine whether latency originates in an application, the network, or the broker itself—leaving teams blind to root cause when performance degrades.
- Asynchronous complexity — Event-driven transactions are non-linear and asynchronous, requiring sophisticated causality tracking across publishers, brokers, and subscribers. Without end-to-end message visibility, delayed or lost events become difficult to pinpoint, and proving delivery or diagnosing failure paths becomes a manual, time-consuming process.
- Fragmented tools — Observability is typically spread across separate systems for applications, brokers, and infrastructure, forcing teams to stitch together insights from multiple dashboards. This fragmentation increases operational overhead and slows root cause analysis, delaying resolution and increasing the cost of outages.
Solace’s Observability Solution: Solace Insights
Solace Insights provides the necessary depth and breadth to monitor the entire event lifecycle—inside the application, across the Event Mesh, and within the broker infrastructure.
- Event broker telemetry: Collects metrics, logs, and broker-internal traces across all deployment form factors to give you continuous visibility into broker performance and infrastructure health, helping ensure platform stability and rapid detection of operational issues.
- Application tracing: Uses client library instrumentation in publishers and subscribers to connect application-level traces with event mesh activity, delivering per-message visibility across success and failure paths, along with end-to-end latency diagnostics.
- Solace Insights backend: Provides a unified, centralized observability layer (powered by Datadog) that brings all telemetry together in a single cloud-delivered experience for visualization, alerting, and analysis—while still allowing export to your APM backend of choice.
The Power of End-to-End Tracing
The traditional way that developers add tracing to the movement of data is by either maintaining point-to-point connections (which we have established is not a successful pattern for scaling or complex needs) or by adding Java agents that sit along side the event brokers (i.e. with Kafka). These introduce additional compute and a lack of visibility making the event broker a black box.
Solace Insights supports full end-to-end context propagation from the application’s origin to its destination native to the event broker. Making events trackable when published, queued, partitioned, acknowledged, and moved to DMQs.
- Standard: Leverages the OpenTelemetry (OTel) standard for trace data.
- Mechanism: Solace client libraries seamlessly inject and extract the OTel TraceID and SpanContext into the event message payload.
- Outcome: A single, unbroken trace that spans all decoupled services and an event mesh built with Solace Platform.
How it Works
- Publisher: Publisher application starts an OTel trace, adds the context to the event payload.
- Solace Event Broker: Broker receives the event, persists the OTel context, and records its internal process as a new span.
- Subscriber: Subscriber application extracts the OTel context from the event, continues the trace, and records its processing time.
- Backend: All spans are sent to Solace Insights back end (or a 3rd Party APM) and stitched together by the common TraceID.
Moving beyond simple broker monitoring, full tracing connects the dots between business outcomes and technical performance.
| Challenge Solved | Solace Tracing Capability | Operational Benefit |
| The “Did it Arrive?” Question | Proof-of-delivery is embedded in the trace data, even in decoupled scenarios. | Auditing & Compliance: Provides undeniable data lineage for regulatory requirements. |
| Pinpointing Latency | Traces show the exact duration of each step: App Processing, Network Transit, Broker Ingestion, Queue Time, and Subscriber Processing. | Fast Root Cause Analysis: Reduces MTTD and MTTR by immediately isolating whether the bottleneck is the publisher, the subscriber, or the Event Mesh. Our customers call it, “less finger pointing” when something goes wrong. |
| Linking Business Transactions | Traces can carry custom tags and business context (e.g., OrderID, CustomerID). | Business Observability: Correlate event flow performance directly with key business metrics. |
| Brining legacy applications to the observability layer | Applications that are impractical to instrument or that are legacy are effectively instrumented at the point of publishing and subscribing | Holistic organizational view: While a true observability aficionado may consider this incomplete, reality is that it solves the problem when the last hand-off is sufficient due to compute or dev costs on some apps. |
End-to-end tracing is the difference between knowing your broker is up and knowing your business transactions are succeeding. Critically, it also provides the mechanism to optimize the data movement layers alongside the applications that publish and subscriber over it. Long spans can help you understand where more compute power is needed, but also where it can be reduced – whatever meets the requirement at scale in a cloud world where costs can easily balloon when not managed.
Platform-Wide Implementation to Support
Enterprise Flexibility in Deployment
Organizations deploy Solace Event Brokers across multiple environments: on-premises appliances, self-managed software in the cloud or on premise, and Solace Cloud managed services. They are also deployed in three form factors.
Solace’s observability solution unifies data collection across all these deployments:
- On-premises appliance deployments — Run Solace brokers in your own data center with telemetry sent over dedicated, secure channels to Solace Insights. Application data always stays inside your internal event mesh; only operational telemetry leaves the environment.
- Self-managed software brokers — Deploy in your own cloud (AWS, Azure, or GCP) or on-premises, with agents streaming telemetry directly to Solace Insights and/or your existing APM tools. The telemetry flow mirrors appliance deployments, giving you consistent visibility regardless of where you run.
- Solace Cloud (fully managed) — Use Solace-managed brokers with a native connection to Solace Insights, plus optional integration with customer APM platforms, delivering out-of-the-box observability without additional infrastructure or agent management.
Solace Insights – Backend Visualization and Alert tool
Solace Insights provides the visualization layer designed for event mesh monitoring so there is no need to manage your own applications or build and maintain custom dashboards and alerts. Fully supported as a cloud service in Solace Platform.
- Unified Dashboarding: Provides a consistent view of health, utilization, and event flows across the entire global Event Mesh.
- Event-Driven Focus: Dashboards and visualizations are optimized for event metrics (Queue Depth, Message Rates, Dead Message Queues).
- High-Scale Data: Designed to ingest and analyze the high volume of time-series metrics generated by large-scale EDAs.
Essential Event Broker Metrics
- Resource Health: CPU Load, Memory Utilization, Disk I/O, Persistent Store Latency.
- Message Flow: Ingress/Egress Message Rates, Queue Depth, Message Discards.
- Client Status: Connection Count, Flow Control Alerts, Slow Consumer identification.
Open Integration with Third-Party APMs
Solace understands that many organizations have substantial existing investments in a centralized observability stack (e.g., Datadog, Splunk, Dynatrace, etc.).
Solace’s observability solution provides flexibility: Use Solace Insights, use your existing APM, or use both. For instance, the corporate operations group, or security teams, may maintain a centralized operations center that can dashboard certain key data from across the company. This is what most large organizations think of when they are really advanced in observability implementations.
In many cases, it is impractical for every middleware team to be part of that center. It can also be impractical to build out complete customizations for your event driven integrations in what is already a very busy group of interfaces in the ops center. This is where the 3rd party export is so helpful because it allows the middleware teams to use Solace Insights dashboards to meet their objectives while sending the key data needed for corporate operations. All without requiring specialized knowledge to maintain the system.
The Benefits of Open Integration
- Avoid Rip-and-Replace: Leverage your existing expertise, training, and correlation tools.
- Standardized Data: All trace data is based on OpenTelemetry, ensuring native compatibility with modern APM tools.
- Consolidated View: Merge Event Mesh metrics and traces with existing infrastructure, microservice, and database telemetry in one dashboard.
Featured Integration: Solace Insights Powered by Datadog
Solace Insights powered by OpenTelemetry includes exporters to Datadog technology in the back end. This creates a naturally seamless export path to other options.
- Broker Metrics: Exportable via Solace Insights.
- Trace Spans: Exportable directly to customer’s Datadog or other OTel Collectors when distributed tracing is enabled in Solace Insights.
- Centralized Broker Logs: Exportable via Solace Insights.
Solace is committed to open standards. Our solution provides deep, event-specific monitoring while respecting and integrating with your wider enterprise observability strategy.
Drawbacks of Kafka Observability
Solace Platform leverages standards to deliver a complete observability solution without limiting extensibility. By way of comparison, Kafka is a tool and inherits limitations of a tool-based approach, including:
- Visibility gaps because no native telemetry and batch processing hiding root causes
- Instrumentation tax of introducing Java agents or manually including OTel SDKs in every service
- Double serialization hit adds higher CPU overhead in Kafka
- Fragile observability stacks with multiple tools to manage
Observability in Action: Examples of Real-World ROI
Solace Insights translates technical features into critical operational outcomes.
Isolating a Transaction Failure
- Scenario: A critical payment event fails to process within the SLA window.
- Before Solace Observability: Hours spent correlating application logs with broker performance data.
- With Solace Observability: The end-to-end trace shows the failure span was 3,500ms inside the Subscriber_Microservice_A’s queue processing step, immediately excluding the Event Mesh and Publisher as the root cause. MTTR reduced by 90%.
Proactive Capacity Planning
- Scenario: A major sales event is expected to double message volume.
- With Solace Insights: Operators analyze historical broker metrics to see the trend of queue depth and network utilization during previous peak periods.
- Result: Proactive scaling of broker resources is performed based on data, preventing potential flow control and message discard during the peak, ensuring business continuity.
Event Mesh Governance
- Scenario: Ensuring all development teams adhere to QoS (Quality of Service) and latency standards.
- With Tracing & Metrics: Dashboards provide real-time latency reports grouped by service and topic. Alerts trigger if P99 latency thresholds are violated.
- Result: Enforced SLAs and immediate identification of rogue applications consuming resources or introducing latency into the mesh.
Simplifying Procurement: Observability is Built-in
The complexity of observability is part of the platform buying process. Solace’s new platform pricing bundles the Solace Insights alongside Event Brokers and other critical services (like the Event Portal). At the lowest tier you benefit from logs and telemetry that you can build your own solution on top of and as you move up the platform tiers you unlock more features, including dashboarding and alerts and end-to-end distributed tracing.
This eliminates the need to purchase, track, and manage separate vendors and licenses for monitoring agents and data ingestion tools.
A Unified Offering
- Solace Event Broker: Provides the message routing backbone and core telemetry source.
- Solace Event Portal: Enables design-time governance and run-time metadata.
- Observability Services: Includes Solace Insights, OpenTelemetry support, and unified telemetry ingestion.
Value Proposition
- Predictable Costs: Observability is a fixed cost within the platform tier, scaling predictably with your overall Event Mesh usage with the price simply built-in.
- Rapid Deployment: Telemetry capabilities are ready out-of-the-box with broker deployment—zero-day observability.
- End-to-End Visibility by Default: Full distributed tracing and broker metrics are standard features, not costly add-ons.
Conclusion: Moving from Blind Spots to Predictability
Solace has developed the industry’s most complete observability solution in what is already the most complete platform for real-time data and agentic AI.
The solution delivers exactly what organization need to meet the challenges that decoupled asynchronous architectures introduce. By embracing OpenTelemetry and unifying its platform, Solace empowers operations teams to move beyond fragmented monitoring to achieve true, end-to-end operational visibility.
- Full Context: Tracing across publishers, the Event Mesh, and subscribers.
- Platform Unity: Telemetry from all form factors into a single backend.
- Openness: Seamless export of data to your existing APM investments.
- Simplicity: Bundled into easy-to-buy platform packages.
Next Steps: Start Your Journey to Complete Visibility
Ready to stop guessing and start knowing the health of your event-driven system?
- Watch a 15-minute demo of the capabilities and functionality described on this page
- Request a Deep Dive Demo: See Solace Insights and end-to-end tracing in action with your team.
- Explore the OpenTelemetry Integration: Check out the documentation for seamless application instrumentation.
- Consult on Platform Pricing: Contact a Solace representative to start a proof-of-concept and how we can get your first project off the ground and in production.