In this week’s installment of our bi-annual Solace Product Update webcast, we formally launched our new distributed tracing capability, PubSub+ Distributed Tracing. We also talked about PubSub+ Event Portal’s new lifecycle management features and plugins for developer tools, our new integrated Kafka bridge and MQ connectors, and upcoming support for partitioned queues.
I’ll summarize the highlights with this blog post. You can watch the entire webcast on-demand here, and I’ve included links throughout this post that will pop you right to that part of the presentation.
Without further ado, I’ll start with the star of the show: distributed tracing!
Enabling Observability with PubSub+ Distributed Tracing
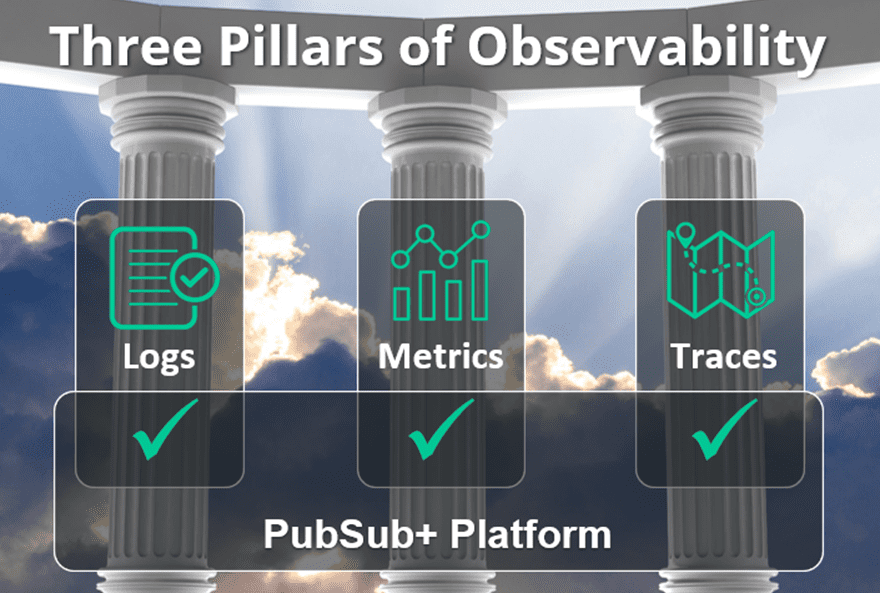
Enterprises are hyper-focused on improving their ability to observe and understand everything that’s going on in their business and IT infrastructure, i.e., “observability.” We’ve always excelled at providing complete, granular, and real-time logs and metrics critical for application performance management. Logs and metrics are also two of the three pillars of modern observability, and now we enable the third: the tracing of events as they flow end-to-end through your organization.
Our new distributed tracing capability checks that third box by emitting trace events in OpenTelemetry format. OpenTelemetry is one of the most popular CNCF projects that is widely supported so you can collect, visualize, and analyze our traces in any compatible tool such as Jaeger, DataDog, Splunk, Dynatrace and many others.
You’ll be able to tell not just if a given message was published, but exactly when and by whom, where exactly it went, down to individual hops, who received it and when…or why not. In addition, contextual information about the data (called metadata) is maintained between applications, microservices, and events. You can use that metadata to more easily and effectively:
- Debug applications to accelerate development
- Troubleshoot delivery problems in production systems, i.e. reduce downtime by quickly and definitively pinpointing the source of event flow problems
- Monitor and optimize your system so you can improve performance and UX
- Validate data lineage to prove delivery, and to demonstrate adherence to data sovereignty and regulatory requirements
You can watch this part of the webcast here, and learn more here.
Demonstration of Distributed Tracing
Principal Product Manager Chris Ault then demonstrated distributed tracing across an event mesh spanning 3 clouds and geographies. He showed how events flowing from a publisher to multiple subscribers generated OpenTelemery traces that were fed to Datadog for visualization, and how a fictional middleware ops manager used that tracing data to figure out a problem with an order processing application, and to show the lineage and consumption of a specific event stream.
I’ve embedded the demo here for your convenience, and here’s a link you can share with colleagues who might be interested.
Getting Started with Distributed Tracing
After the demo I explained how easy it is to get started with the free demo-mode in PubSub+ brokers or as a free cloud-managed trial:
- Software or Appliance: Just download version 10.2.1 and read these docs to set it up.
- Cloud: Contact your sales rep and ask them to enable it for you.
New PubSub+ Event Portal Features
Lifecycle Management
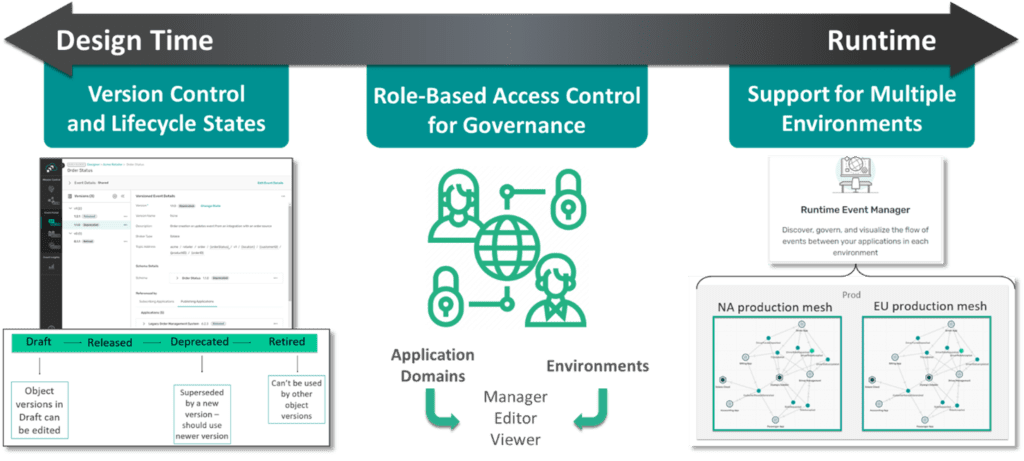
After launching distributed tracing, we announced the general availability of some exciting new lifecycle management capabilities that let you manage events and event-driven architecture (EDA) assets from cradle to grave, across design-time and run-time environments. Features like fine-grained role-based access controls, object versions, lifecycle states and environments all combine to let you increase event reuse and ensure consistent development practices and governance across your event mesh.
Event Portal Integration with SDLC Tools
The announcements kept coming with an overview of a new family of open source plugins that let you integrate your favorite SDLC tools into the development and evolution of event-driven applications, APIs, schemas, etc. For a real good explanation of what they are, how they work, and how you can benefit from them, check out my colleague Jesse’s recent blog post, Supercharge your Software Development Lifecycle with PubSub+ Event Portal.
What’s Next for Event Portal?
While I’m proud of what we’ve achieved so far, I think you’ll be blown away by where we take Event Portal in 2023. In the webcast I talked about exciting upcoming advances in the areas of discovery and auditing from your Solace and Kafka brokers, a self-service developer portal API that integrates with tools like Gravitee.io and other APIM partners, and analytics to help you understand both design data and runtime metrics.
It can be hard to learn when starting from a blank page, so to make it easier to learn how to use Event Portal and see best practices in action, we’re adding sample applications to Event Portal that should give you a nice little head start when designing your event flows. We’re starting with samples from three verticals: retail, natural resources and aviation, and will be adding more over time. You can access them within Event Portal – try them out!
The announcements kept coming with an overview of a new family of open source plugins that let you integrate your favorite SDLC tools with Event Portal. For a real good explanation of what they are, how they work, and how you can benefit from them, check out my colleague Jesse’s recent blog post which includes a video demo of each tool integration, Supercharge your Software Development Lifecycle with PubSub+ Event Portal.
Fully Integrated Kafka Bridge
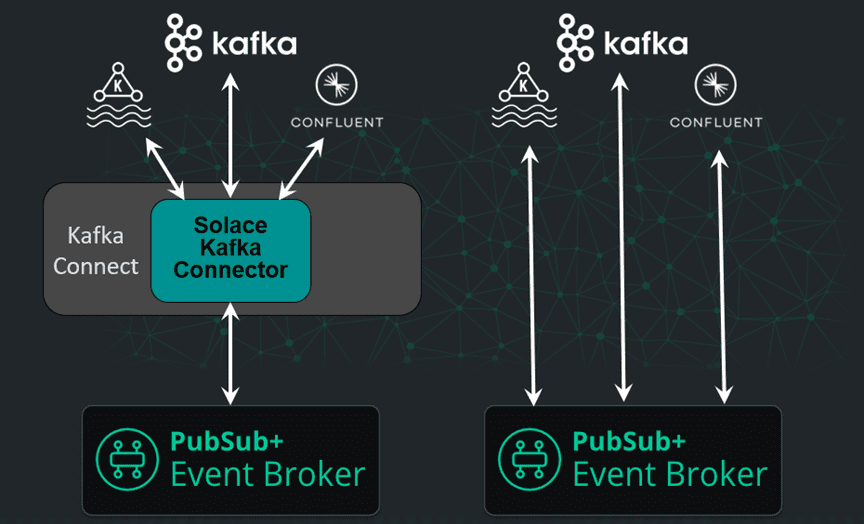
We’ve supported the integration of Kafka brokers and event streams for a while with sink and source connectors, but have made it way easier by building a bridge directly into PubSub+ Event Broker. This more direct means of integration makes it easier and less expensive to tie any Kafka environment, including Confluent and MSK, to your event mesh. You can watch this part of the webcast here, and if you’d like to check it out, contact your account exec for early access which will start in Q1 2023.
New Connectors
Kafka isn’t the only technology we’ve improved the integration of, though – we’ve just released a new IBM MQ connector powered by Spring Cloud Stream. It’s the first of many we’ll release, with connectors for TIBCO EMS and a general-purpose JMS coming next. These open source connectors are based on Spring Cloud Stream so you can use them for free, and we offer optional paid support. They can be run as standalone apps with or without Docker, or deployed to Kubernetes. They natively support high availability and the display of metrics, and can be easily integrated with your existing monitoring tools.
Next year we’ll be adding a connector management server that will help you configure and manage these connectors with sophisticated monitoring and logging functionality.
You can watch this part of the webcast here, and find this new MQ connector, along with all Solace and partner connectors, on our Integration Hub.
Coming Soon: Partitioned Queues
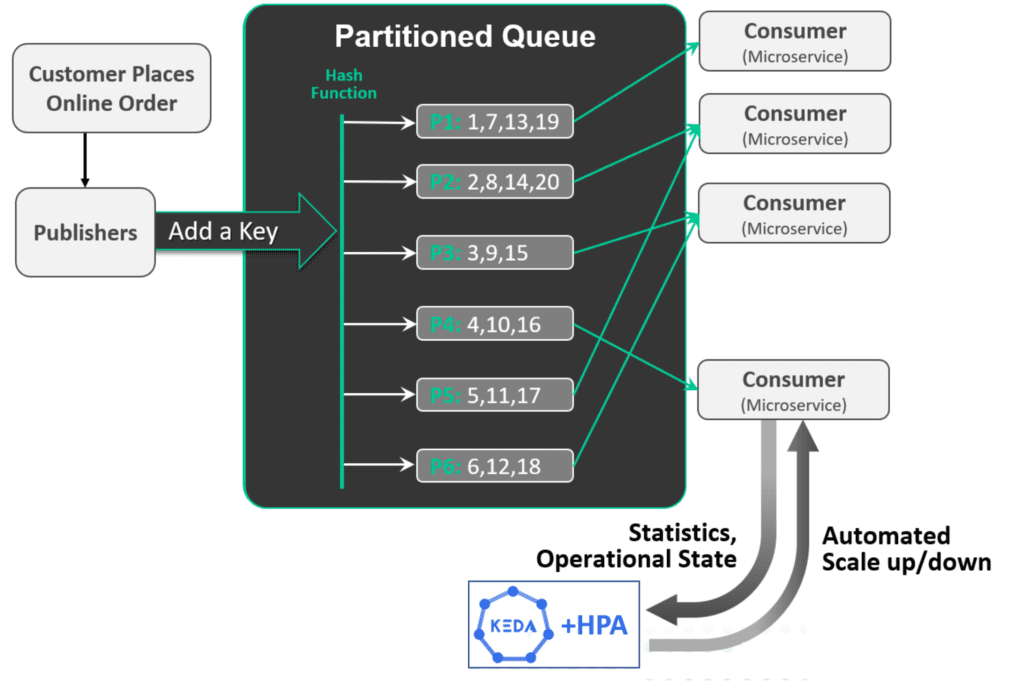
We’re introducing a new kind of queue called partitioned queues that are kind of like Kafka consumer groups, but way better! Partitioned queues will make it easy to horizontally scale consumer microservices while maintaining the sequence of events. You can even integrate them with consumer automation tools to dynamically scale your microservices as demand goes up and down so you can “right size” for typical traffic without worrying about the impact of sudden bursts of activity – all in a cloud native manner.
Partitioned queues have several advantages over Kafka, namely:
- You can scale consumers AND filter events by consuming multiple topics AND maintain the sequence of these events as they were published – not possible with Kafka
- Partitions are local to a consumer – so different consumers can have different numbers of partitions and if you need to repartition for a consumer you don’t affect any other consumers – whereas with Kafka, repartitioning a topic affects all consumers
- Adding/removing consumers on a partitioned queue results in minimal traffic interruption and only on affected partitions. There is no “stop the world” event.
You can watch this part of the webcast here.
Conclusion
My goal here was just to cover the highlights of this week’s product update – I hope I’ve piqued your interest enough to watch the whole thing! Check it out.
Explore other posts from categories: Product Updates | Products & Technology

 Shawn McAllister