Every enterprise faces challenges in terms of coping with market demands and reacting to business events quickly enough to achieve the organizational goals. In this blog post I will explain how event-driven architecture helps enterprises improve agility and responsiveness by making their data analytics dashboards, specifically those built with Power BI, real-time.
What is Data Analytics?
Enterprises generate and store all kinds of data in areas like supply chain, master data, IoT feeds, digital marketing, promotional data and so on. Data analytics is a process of analyzing raw data by applying data slicing techniques and algorithms for inspecting, cleansing, transforming, and modelling data with the goal of discovering useful information, informing conclusions, and aiding decision making. There are many data analytics tools/solutions available in the market and Microsoft Power BI is one among the widely used tool in many enterprises.
Think about some of the below use cases and the need for real-time ingestion to update the dashboards:
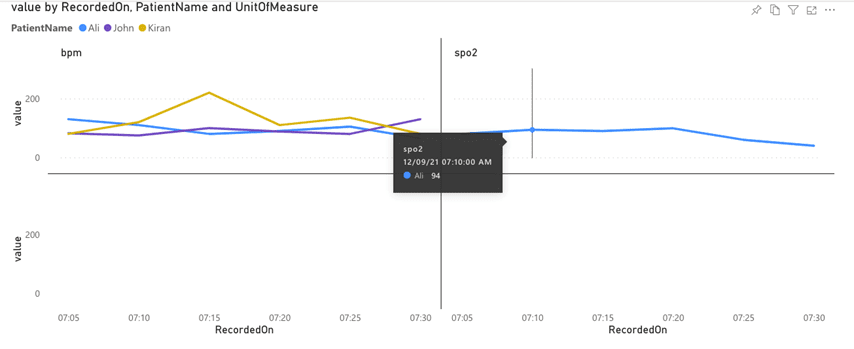
- Collecting patient’s health data from IoMT sensors and plot the statistics with respect to time for continuous monitoring on the patient’s condition.
- Collecting data about COVID-19 spread in neighboring countries and perform the risk analysis to take preventative measures.
- Tracking supply chain parameters like “Fill Rate %” to understand the warehouse stock movement and maintain the right stock availability to handle the market demands.
Why Event-Driven Architecture?
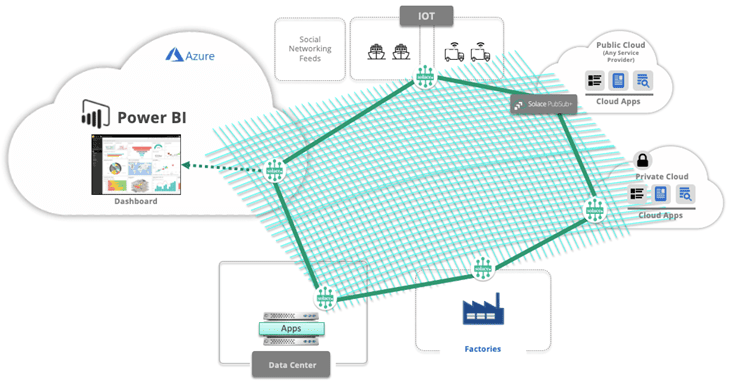
Event-driven architecture gives you the power to stream information between applications, microservices and connected devices in real-time, as events occur throughout your business. As the diagram depicts, intranet and internet-based events can flow across the organization and be consumed by any application that has expressed interest of the events.
Solace PubSub+ Event Broker can deliver the events to REST APIs in a real-time by using REST delivery points (RDPs).
Quick Background on Power BI
Power BI aggregates data from many sources to create interactive, immersive dashboards and reports that provide actionable insights and drive business results.
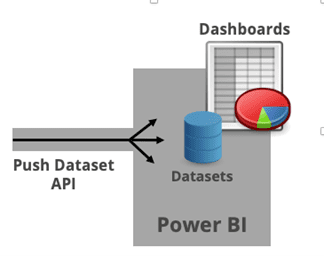
- Power BI dashboards can be built on a wide variety of data sources
- Power BI datasets is one among the listed data sources.
- Datasets can be populated by using the Push datasets REST API.
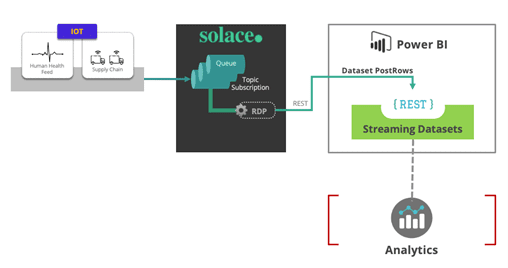
Here is a high-level flow diagram that shows the work items it takes to achieve real-time data ingestion to Power BI.
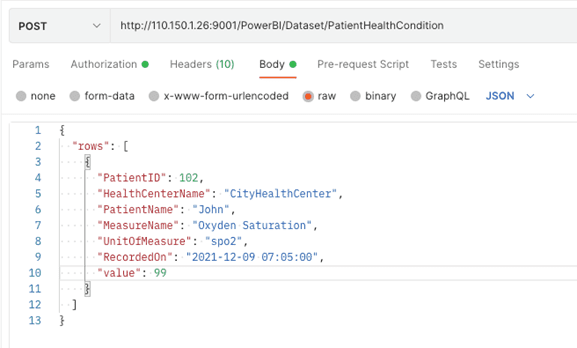
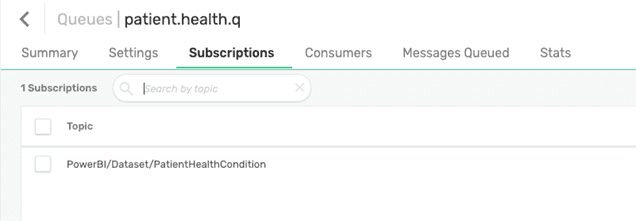
Postman can be used to simulate IoT feeds which publishes event to Solace and those events can be collected at a queue patient.health.q by subscribing topics specific to health IoT sensors. Configured RDP will deliver the event to Power BI dataset with the help of push datasets API.
5 Steps to Enabling Event-Driven Dashboards
Here are the steps to enabling event-driven dashboards:
1. Identify Power BI Push Dataset API
I am going to use two Push APIs to achieve this:
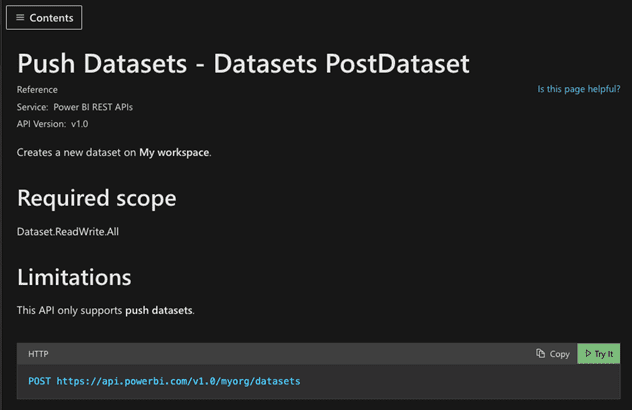
- Post-Dataset to create the dataset in Power BI schema.
- Post-Rows to publish the rows into the defined dataset
Follow this link for more details on Push Datasets API. Before getting into the configuration, please sign up at https://app.powerbi.com/home to make sure you have Power BI (it can be an enterprise or trial version).
2. Create Dataset
Follow the below Microsoft documentation to create datasets by using post-dataset API
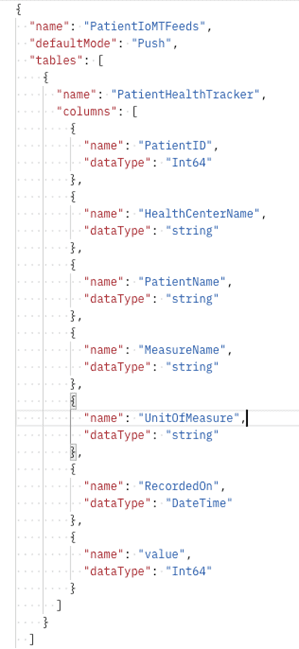
- Design a JSON payload as per the post-dataset documentation.
- Create dataset by posting the JSON payload through Post-Dataset API.
- Bearer token can be picked up from “Try It” option of post-dataset API to authenticate it.
Note:
- Datasets have to be created through Push Dataset API to add the rows through Post-Rows API.
- This is the one-time activity to create a dataset and it can be executed in Postman.
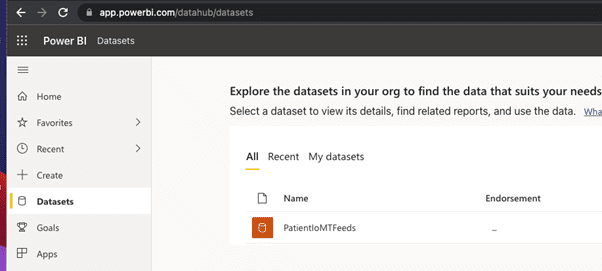
You can validate this step by checking the datasets section in Power BI.
Prepare Power BI Post-Rows API URL to publish the row to dataset:
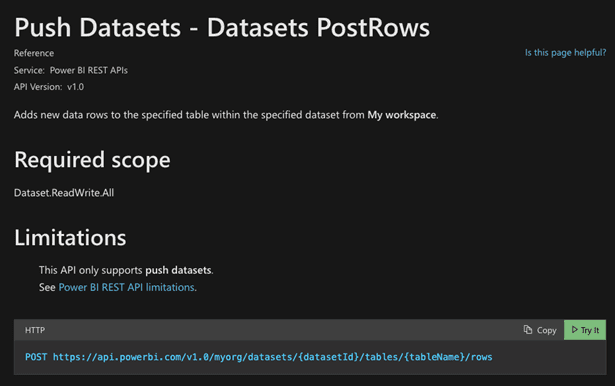
- Follow the below Microsoft documentation to post the rows to datasets.
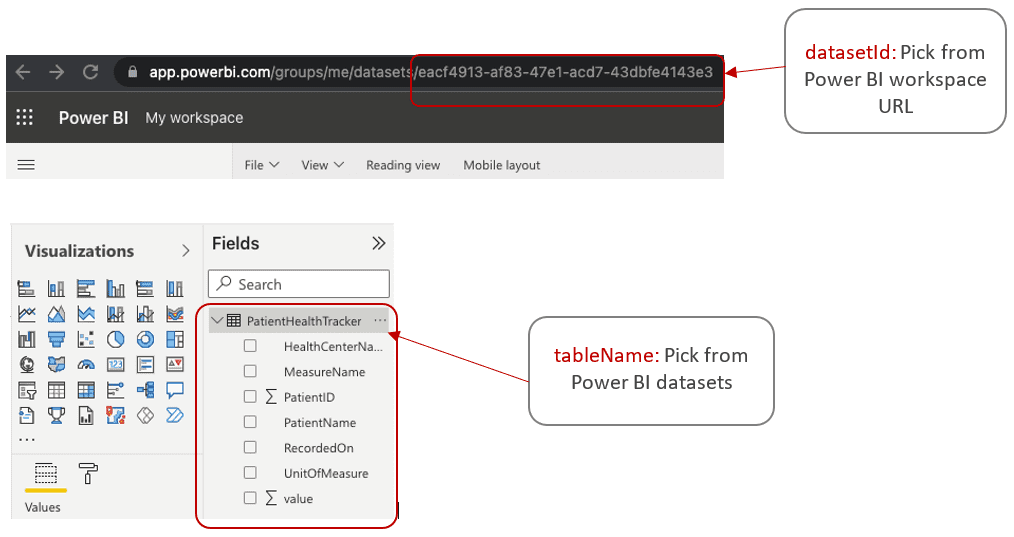
- Pick the API URL format from the documentation and fill in the required parameters as per your environment: https://api.powerbi.com/v1.0/myorg/datasets/
{datasetId}/tables/{tableName}/rows
3. Prepare Solace to configure REST Delivery Point (RDP)
Deploy Power BI certificates in Solace:
- Derive certificates from Power BI URL.
- Convert “cer” files to “pem” format and copy the files to ”certs” folder of Solace using scp/ftp.
openssl x509 -inform der -in <>.cer -out <>.pem
scp -P2222 *.pem ftpuser@IP_ADDRESS:/certs/ - Create “Client Certificate Authority” with the generated “pem” files.
4. Configure RDP with Post-Rows API
Login to Solace and Navigate to “clients” page in left panel and click on REST tab to add new RDP object called “Azure”.
5. Create Power BI Dashboard and Validate Real-Time Data Load
Create REST Consumer object within “Azure” object. Provide connection configuration:
Select HTTP Header as Auth Scheme and Bearer token. Fill in the authorization header as per the “Try It” documentation of the post-rows API.
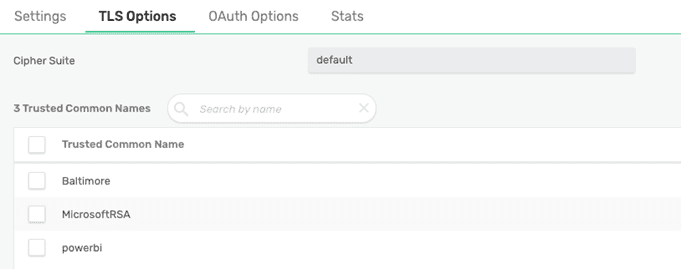
Once the REST consumer is created, go to “TLS Options” tab and fill in all the “Trusted Common Names” (Note: Refer Create “Client Certificate Authority” step, as the common name should match the certificate authority name).
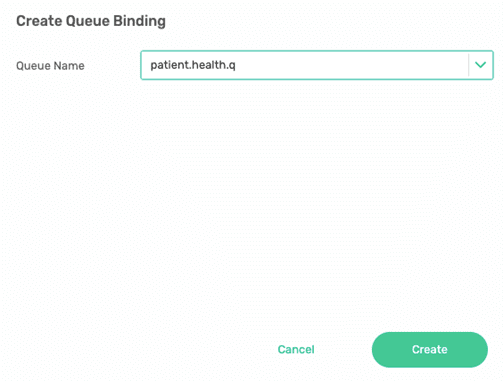
Add queue binding object under “Azure” RDP.
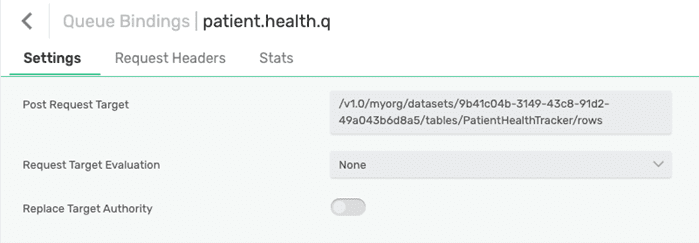
In “Post Request Target” field, fill in with the post-row URI with the parameters.
After successful configuration of RDP, operation state of RDP should be up. Also, a consumer should get attached to the queue.
All good so far, now it’s time to validate the Power BI dashboards on how they are refreshing in real-time:
- Publish data to Solace in the same format based on the dataset “PatientHealthTracker” schema.
- Ensure to add the topic subscription to “patient.health.q”.
- The published event to Solace should get reflected in Power BI dashboard.
Conclusion
I hope this blog post helps you better understand the advantage of using event-driven architecture to feed real-time data to your data analytics dashboards. Introducing event-driven architecture to the enterprise brings liveliness to the estate of applications allowing them to communicate in real-time and ensures respective key indicators to be visualized to make accurate and timely decisions.
Explore other posts from category: For Developers

 Suresh Kumar