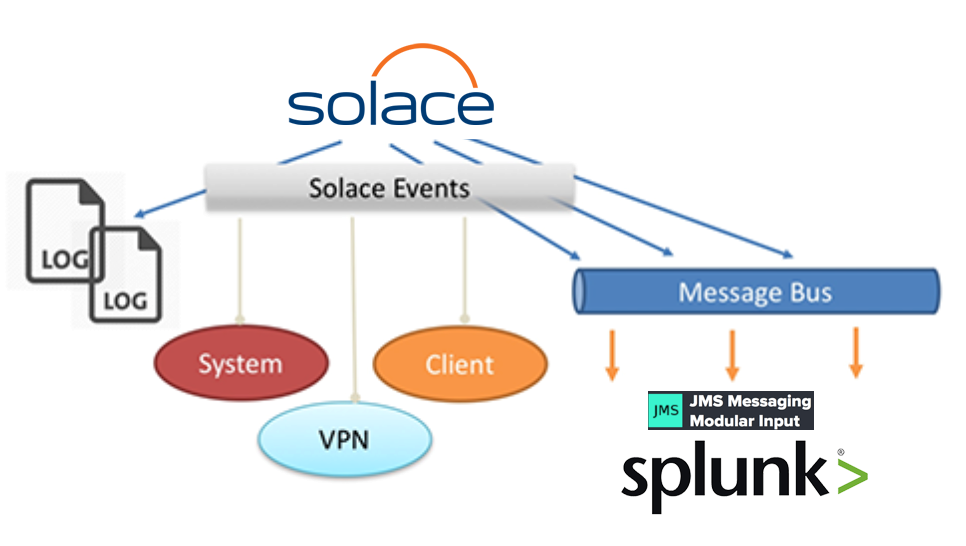
 In this blog post, I am going to demonstrate how to integrate Solace with Splunk using JMS Messaging Modular Input (aka
 jms_ta). Splunk can ingest data from multiple sources using variety of Data Inputs; jms_ta is one them which is used to ingest data into Splunk from a JMS Broker. This blog builds on top of an existing blog Handling Solace Message Router Events in Applications. This is an excellent reference to build your understanding about Solace Message Router Events mechanism.
We will demonstrate how the following Solace Messaging Events gets ingested into Splunk via Modular Input JMS (jms_ta):
- Client Connect / Disconnect
- Subscription Add / Remove
* You can refer to Solace Events Reference online documentation for complete list of Events with detailed description of each.
Solace Base Setup
Splunk can be integrated with our appliances and software brokers.
Splunk Base Setup
- You can use an existing Splunk installation or Install a fresh new instance
- Install
jms_taby following instructions at JMS Messaging Modular Input - Copy following Solace JMS Jars at
$SPLUNK_HOME/etc/apps/jms_ta/bin/libsol-jms-<x.y.z>.jarsol-jcsmp-<x.y.z>.jarsol-common-<x.y.z>.jarcommons-logging-<x.y.z>.jarcommons-lang-<x.y.z>.jar
- Restart Splunk so that JMS Modular Input is detected and is visible in Splunk Admin GUI
Solace Configuration
Now that we have Solace VMR up and running, let’s get started by creating necessary objects:
Create VPN (Name = SplunkVPN)
- Enable VPN to publish “Client Event” & “Subscription Event” messages
- Set Authentication type to “Internal”
- Set the “Maximum Spool Usage” to 100 MB
Modify existing Client Profile (Name = default)
- Enable “Allow Guaranteed Message Send” & “Allow Guaranteed Message Receive”
Create Client Username (Name = splunk)
- Set password (splunk)
Create Durable Queue Endpoint (Name = Events)
- Set “Access Type” to “Non-Exclusive”
- Set “All Other Permissions” to “Consume”
- Add following Topic Subscriptions for the events we are interested to monitor to “Events” queue
| Event to monitor | Topic String (wild carded) |
|---|---|
| Client Connect event | #LOG/*/*/*/CLIENT_CLIENT_CONNECT/> |
| Client Disconnect event | #LOG/*/*/*/CLIENT_CLIENT_DISCONNECT/> |
| Add Subscription event | #LOG/*/SUB_ADD/> |
| Remove Subscription event | #LOG/*/SUB_DEL/> |
** Topic to Queue bridging is one of the most powerful Solace feature that helps wiretapping the data flow seamlessly. The Topic Subscriptions can be added / removed on the Queue without shutting down the ingress / egress ends of the Queue. A good example is let’s say you want to start monitoring the Client’s Flow Open and Close events, simply adding #LOG/*/CLIENT/*/CLIENT_CLIENT_OPEN_FLOW/SplunkVPN/>
#LOG/*/CLIENT/*/CLIENT_CLIENT_CLOSE_FLOW/SplunkVPN/>
topics to the Events Queue will enable the wiretap these additional events to flow into Splunk.
Configure JMS Access to message VPN
Enable “Client Access” for “SplunkVPN” under the “JNDI Properties” view
- This allows the JMS clients (e.g. Splunk JMS Modular Input) to access the JNDI store, lookup and bind to objects. If this access is not enabled, then JNDI requests from clients will receive empty “503 Service Unavailable”
Create Connection Factory (Name = cf/splunk)
- Uncheck “Direct Transport” checkbox under Transport Properties
- Uncheck “Text Messages Are XML” checkbox under Messaging Properties
Create JMS Queue
- JNDI Name = solace/SplunkVPN/Events
- Message VPN = SplunkVPN
- Physical Name = Events (This is the physical Durable Queue endpoint)
Splunk Configuration
We will create a separate Splunk Index for storing Solace Events information separately. This is an optional configuration. You could choose to ingest Solace events into any existing index.
Navigate Splunk Menu to create a new Index.
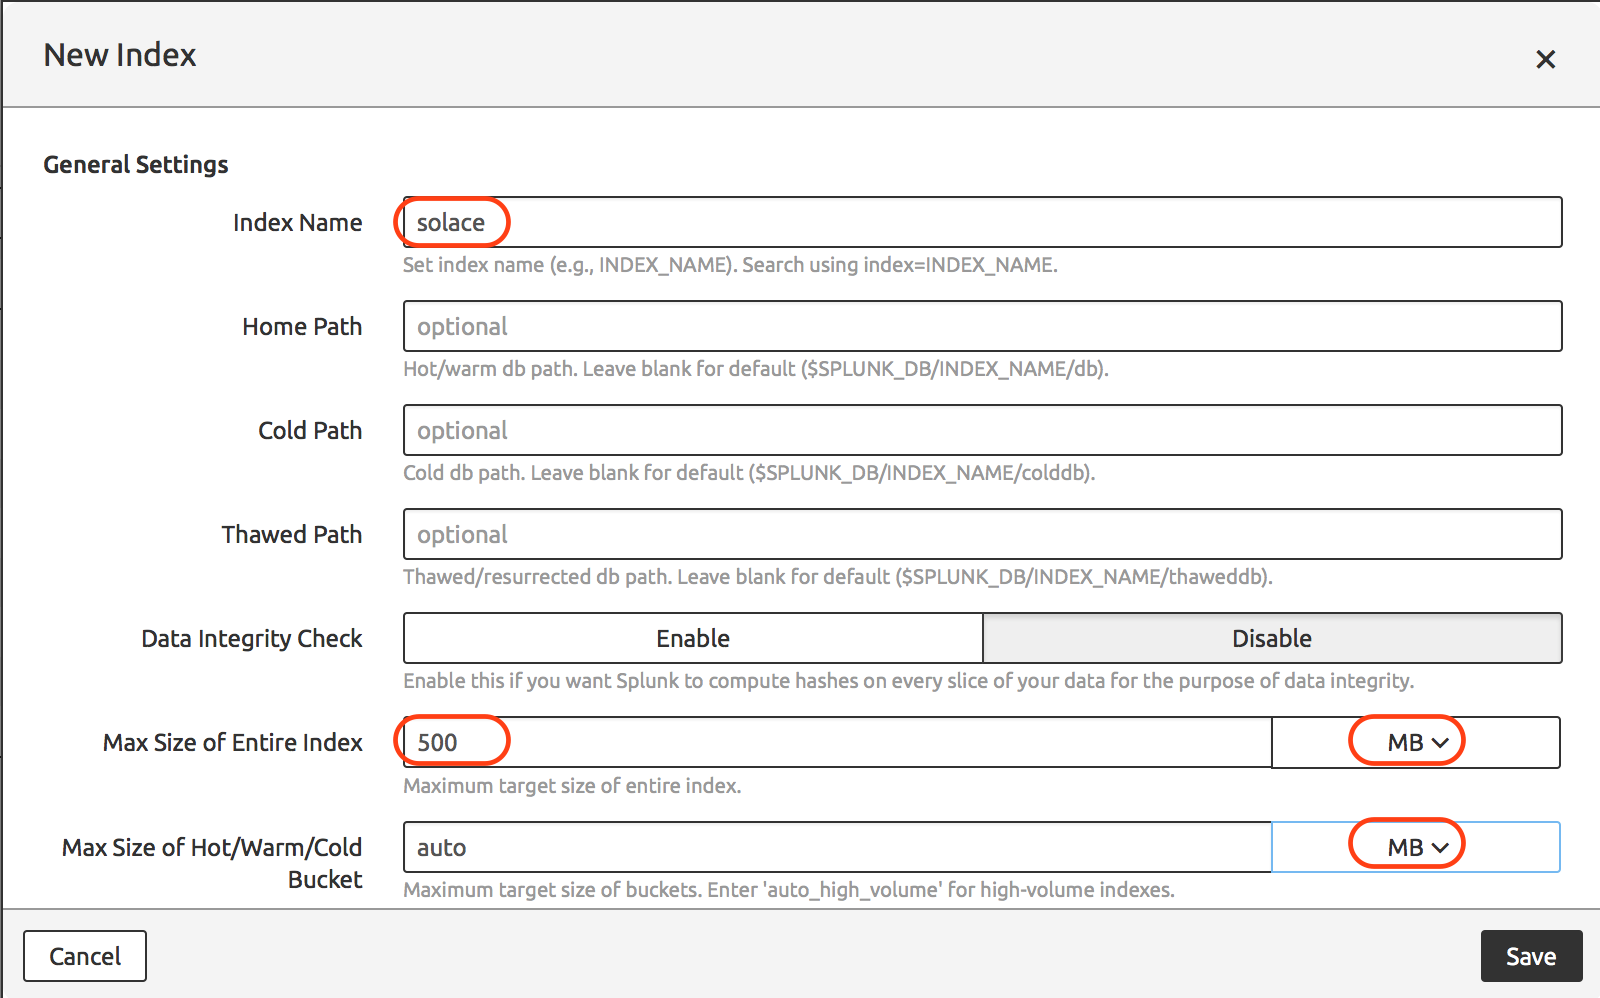
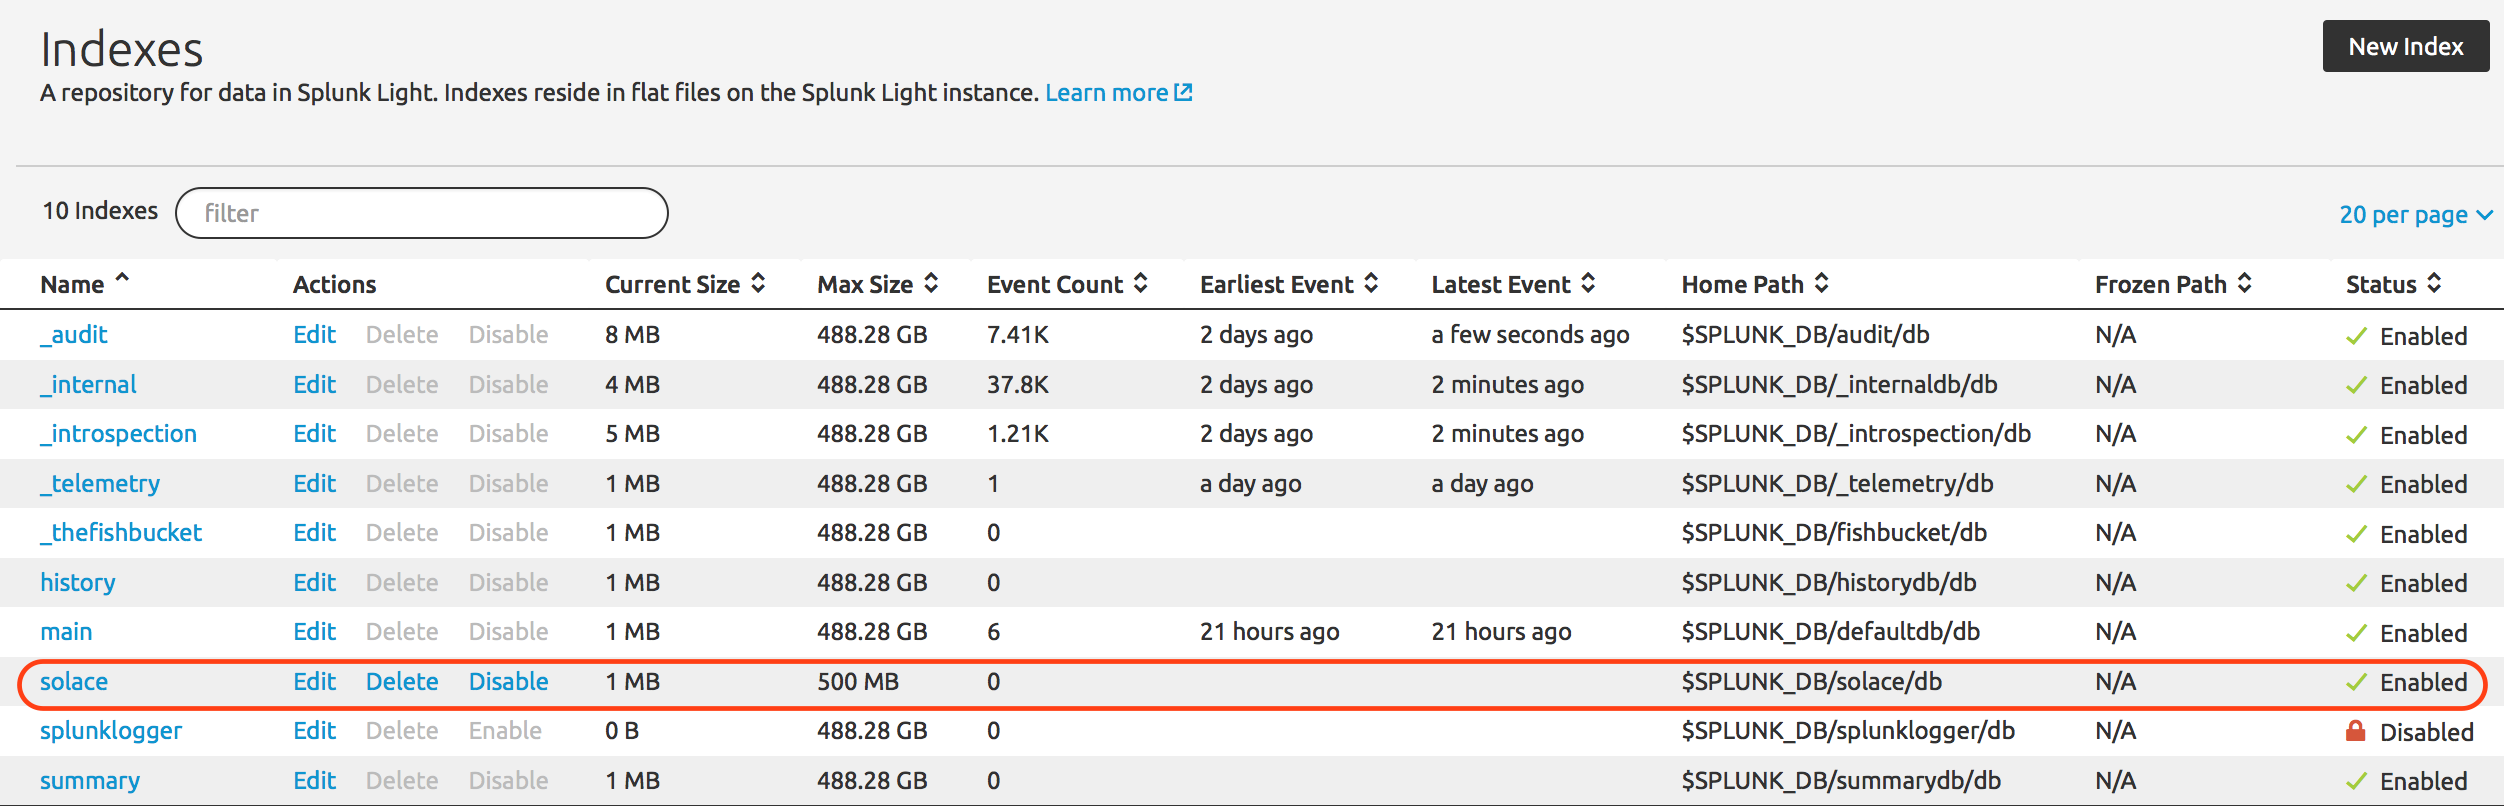
After successful index creation it should appear in the index list as per below.
JMS Messaging Modular Input (jms_ta) configuration:
You would have a JMS Data Input ready for configuration if everything went well as described in JMS Messaging Modular Input.
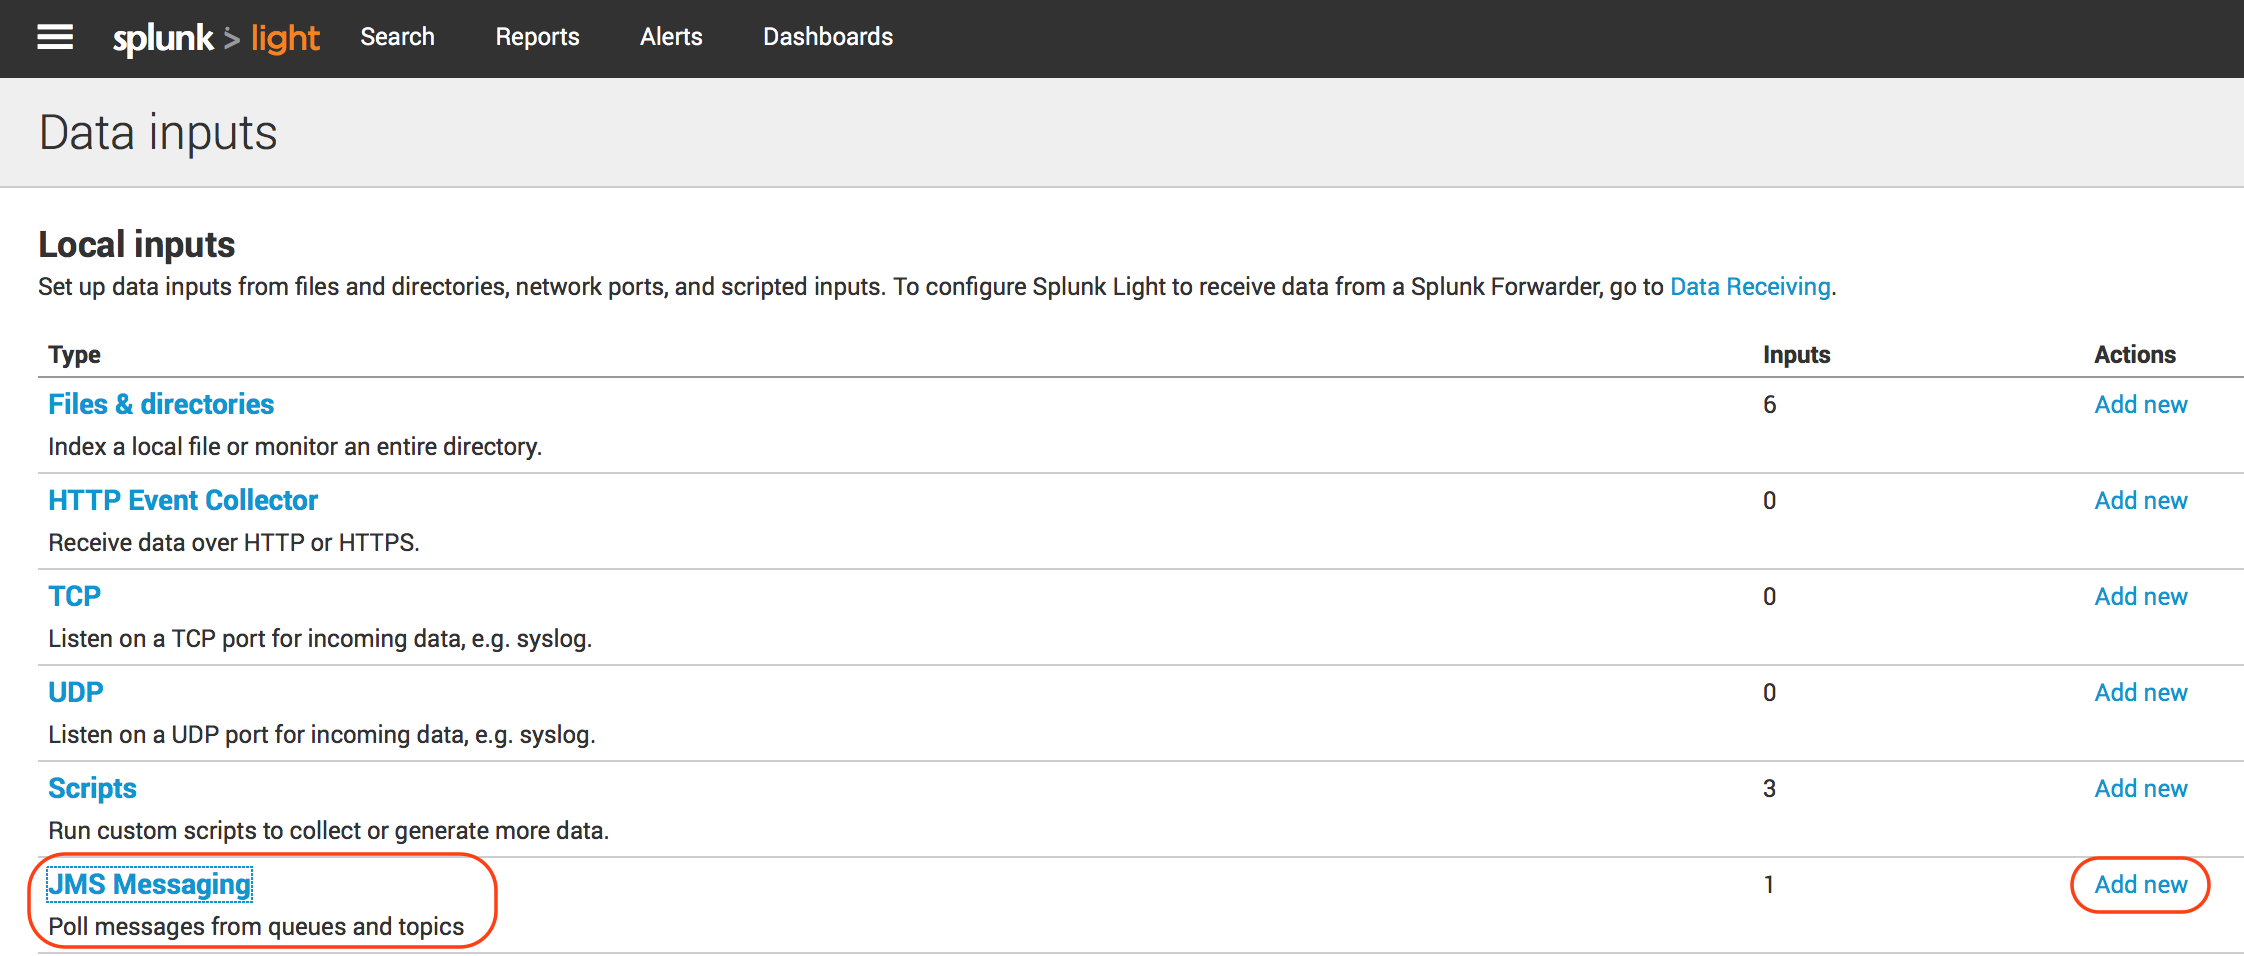
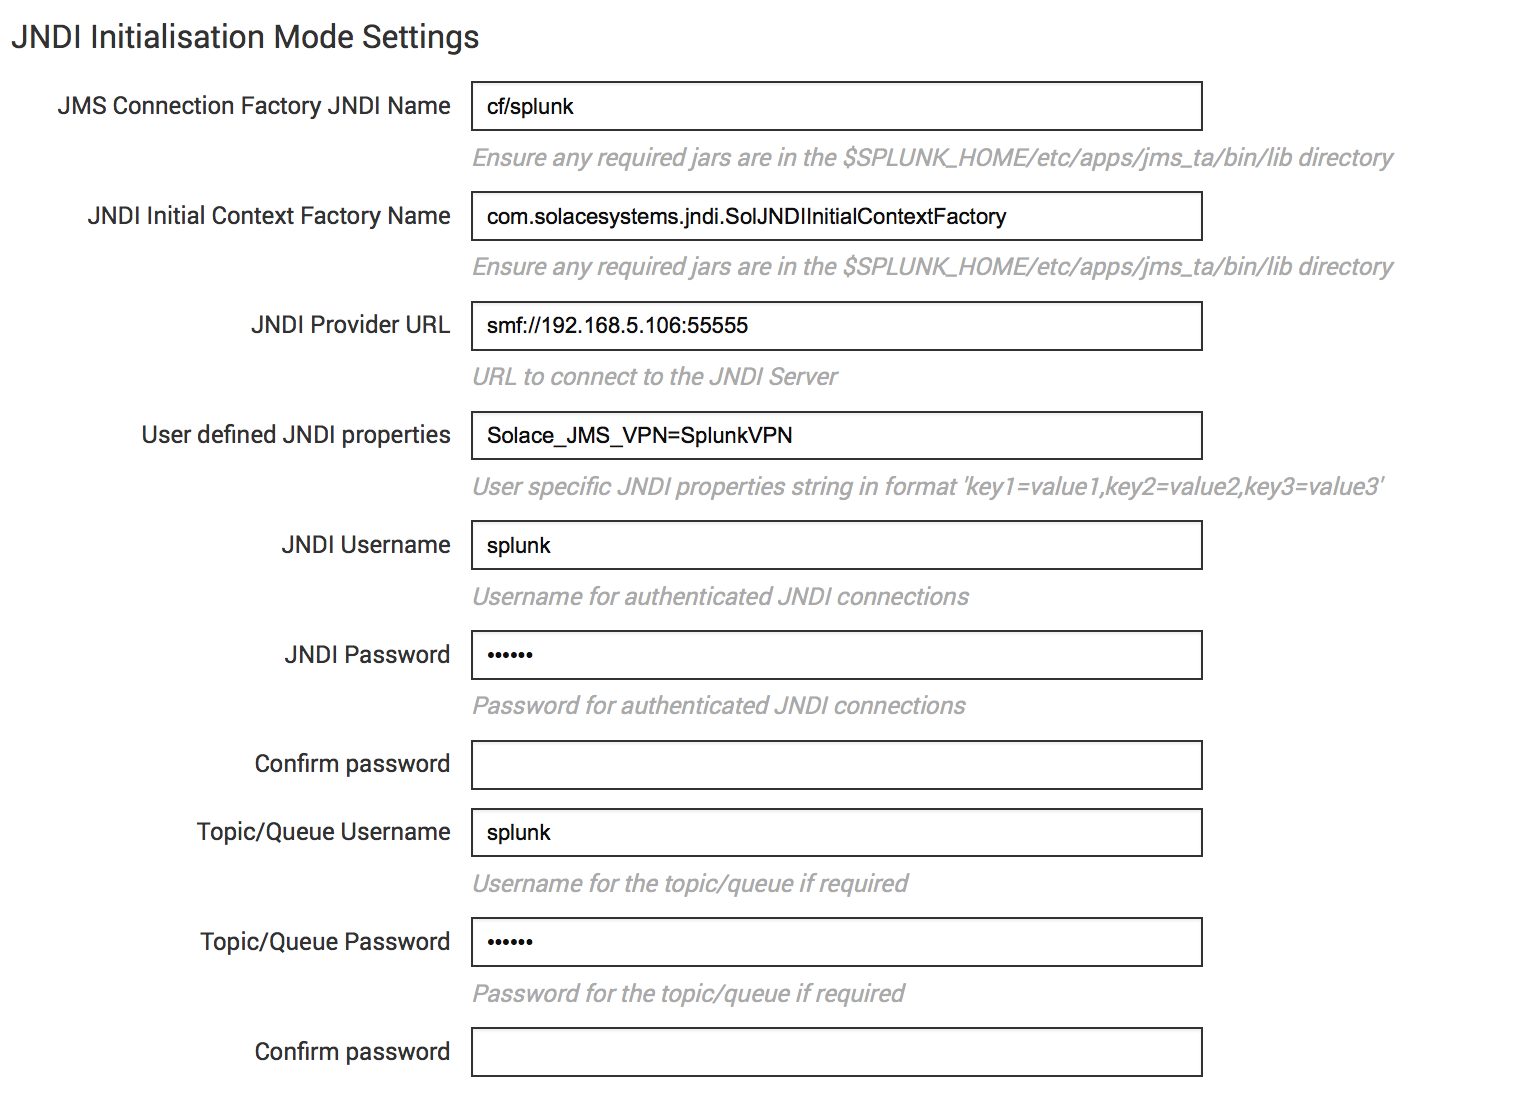
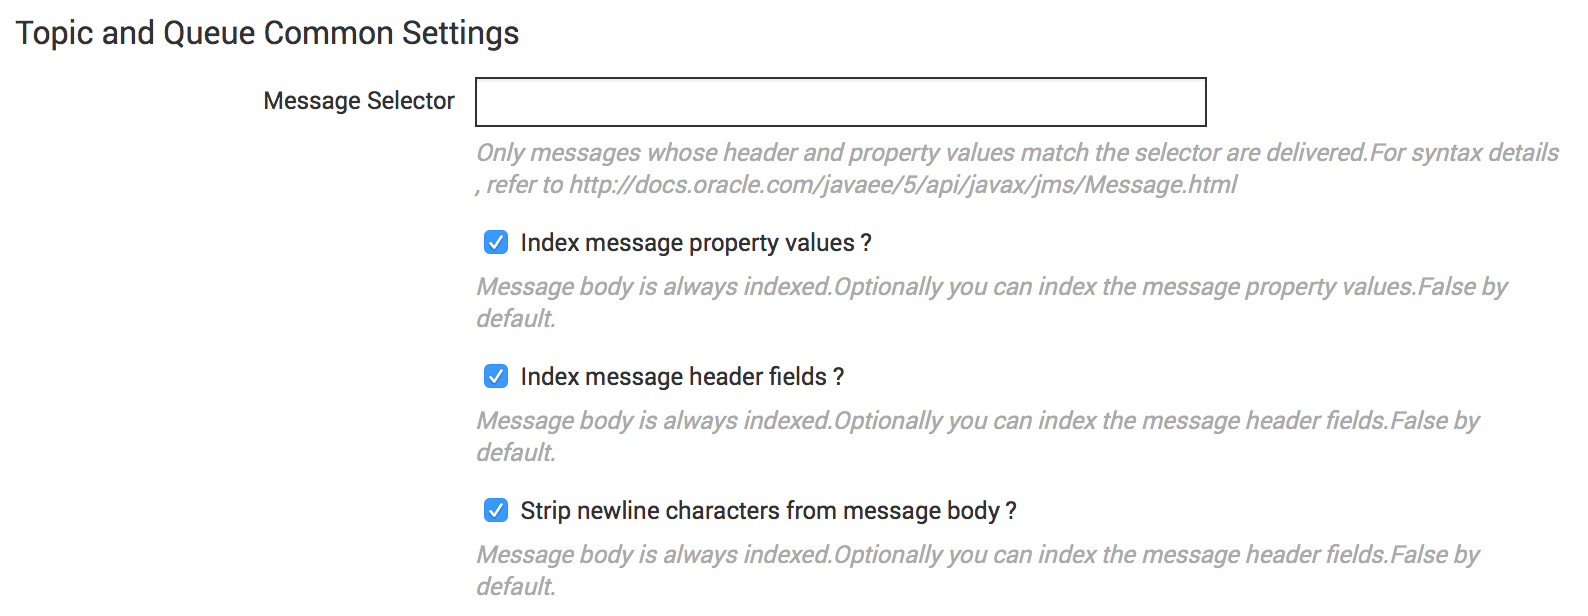
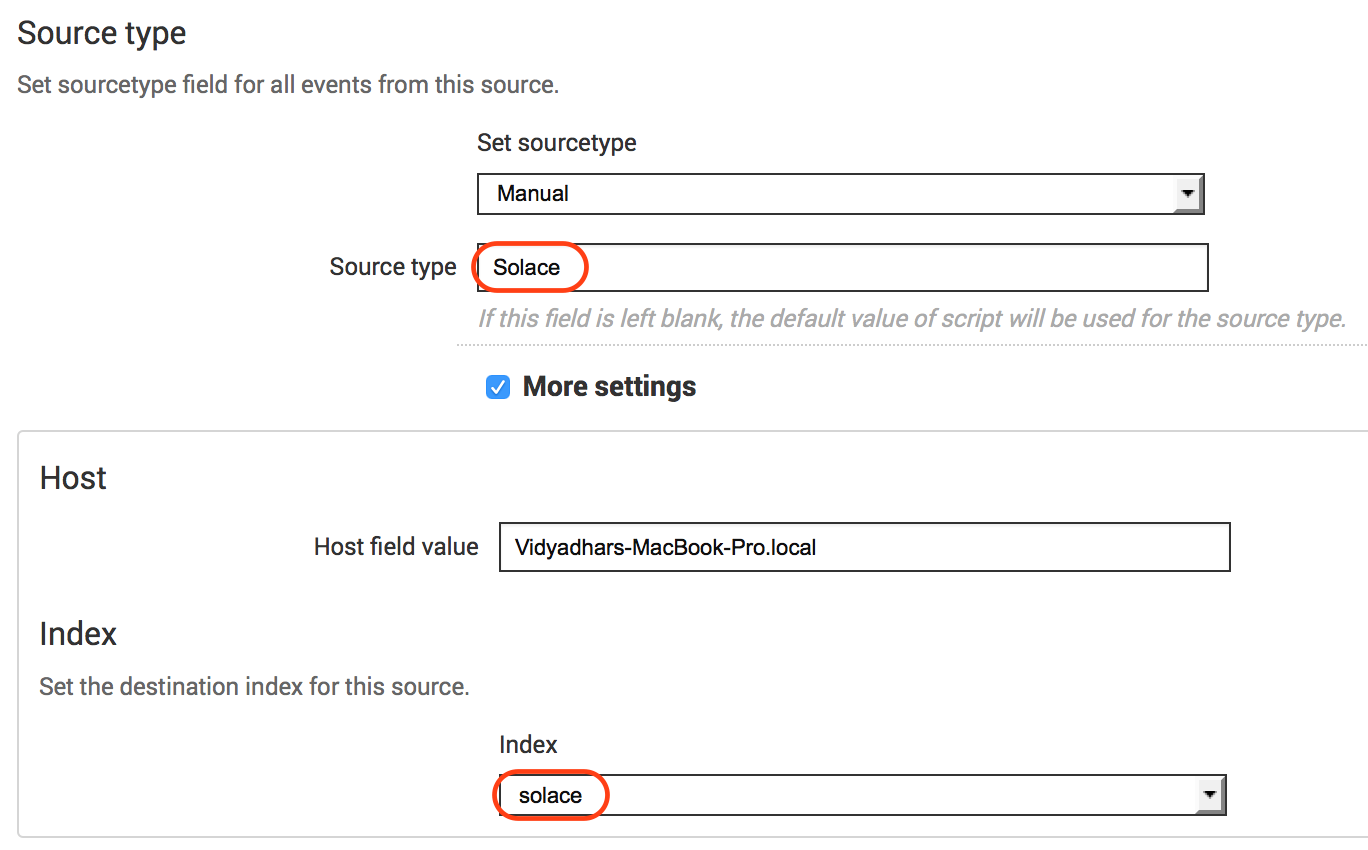
Click “Add new” to create a new JMS Data Input to consume Solace events from “Events” queue configured in the above section. Provide the details as per below information. The configuration is pretty simple and is based on standard JNDI JMS consumer configuration. Refer to the following pictures for the values to be used for configuration.
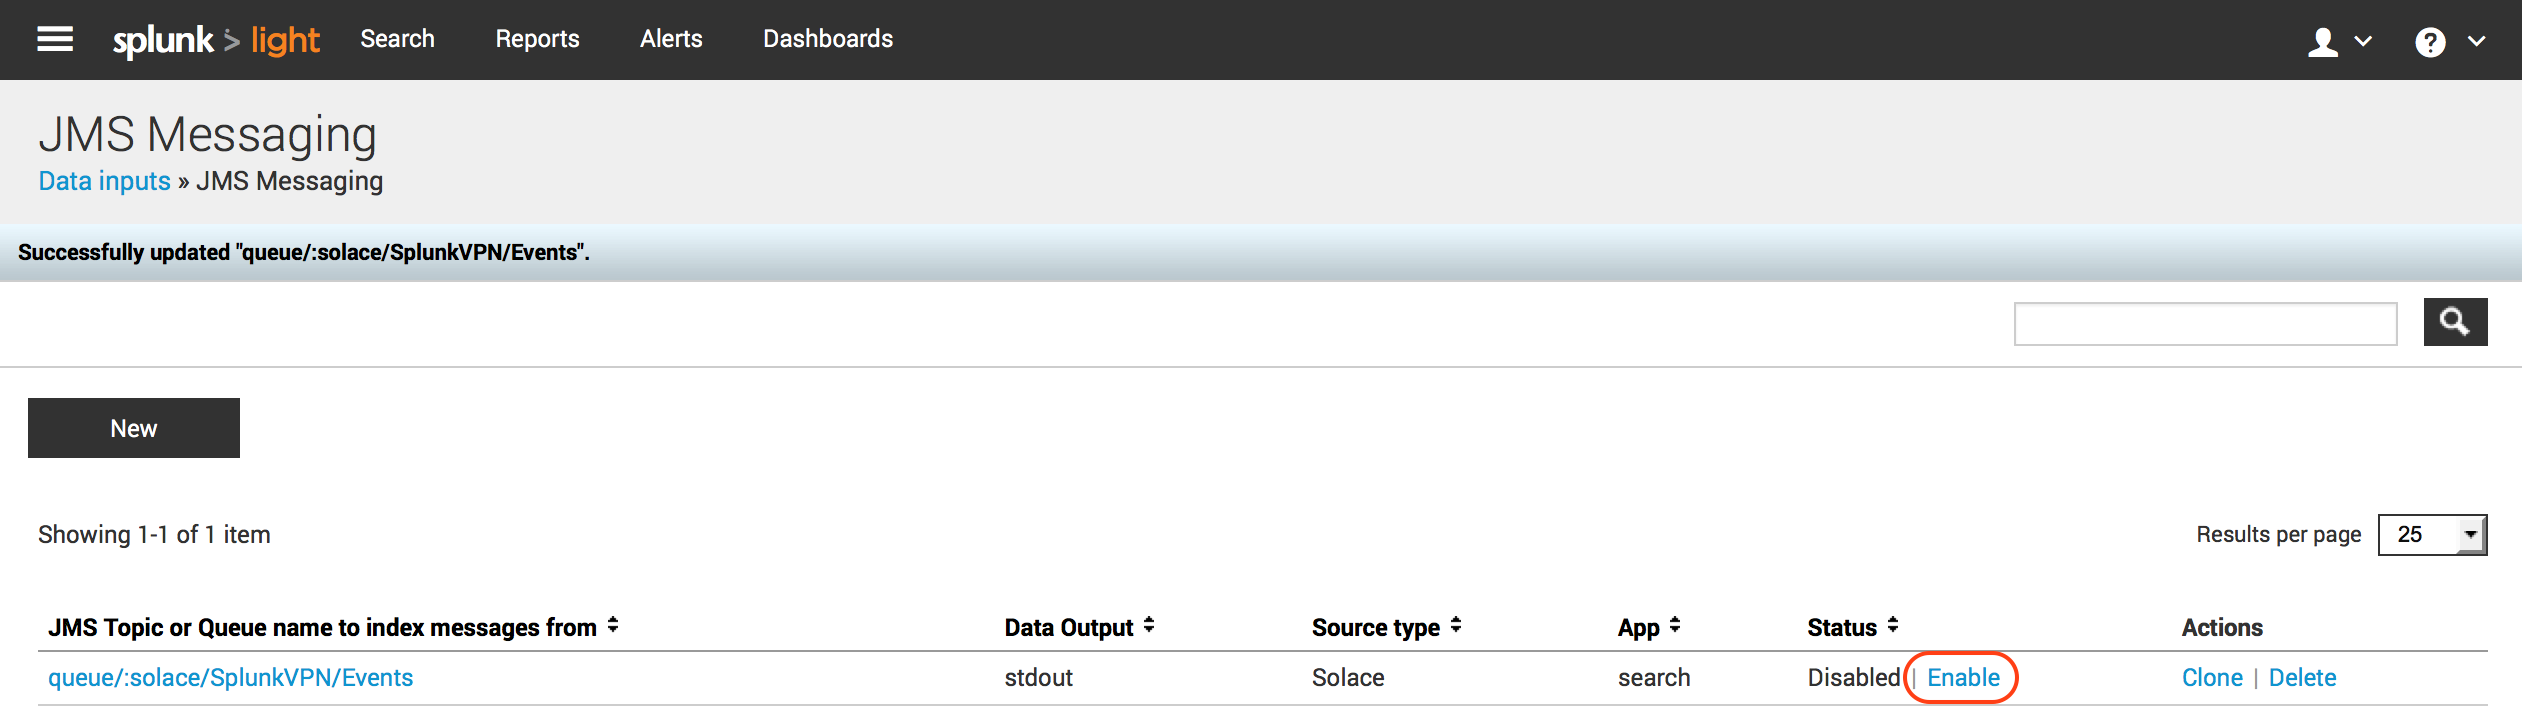
Once the configuration is completed and saved, it should reflect in the Data Inputs section as below. Ensure that the Data Input is “Enabled” which indicates that Splunk JMS data input is now connected and listening on “solace/SplunkVPN/Events” queue. Validate that Client is connected to Solace VMR and has bound to “Events” queue using either of the Solace Admin tools – Solace Admin GUI OR Command Line Interface.
Run and Validate the setup
We are now ready with all the configuration required on Solace VMR and Splunk. We will generate the events we are interested in by running following SDKPerf command. (Please refer to SDKPerf Information on Solace Developer Portal)
./sdkperf_java.sh -cip=<Solace VMR IP>:55555 -cu=splunk@SplunkVPN -cp=splunk -stl=test/topic/events/splunk
You will see SDKPerf output similar to shown below.
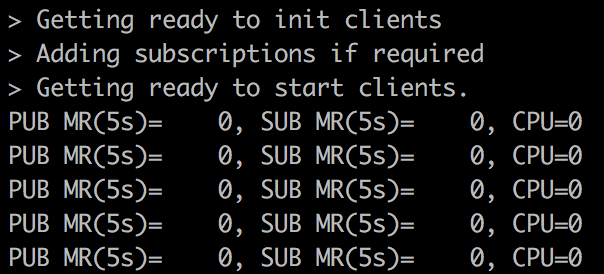
Terminate SDKPerf command using “Ctrl+c”.
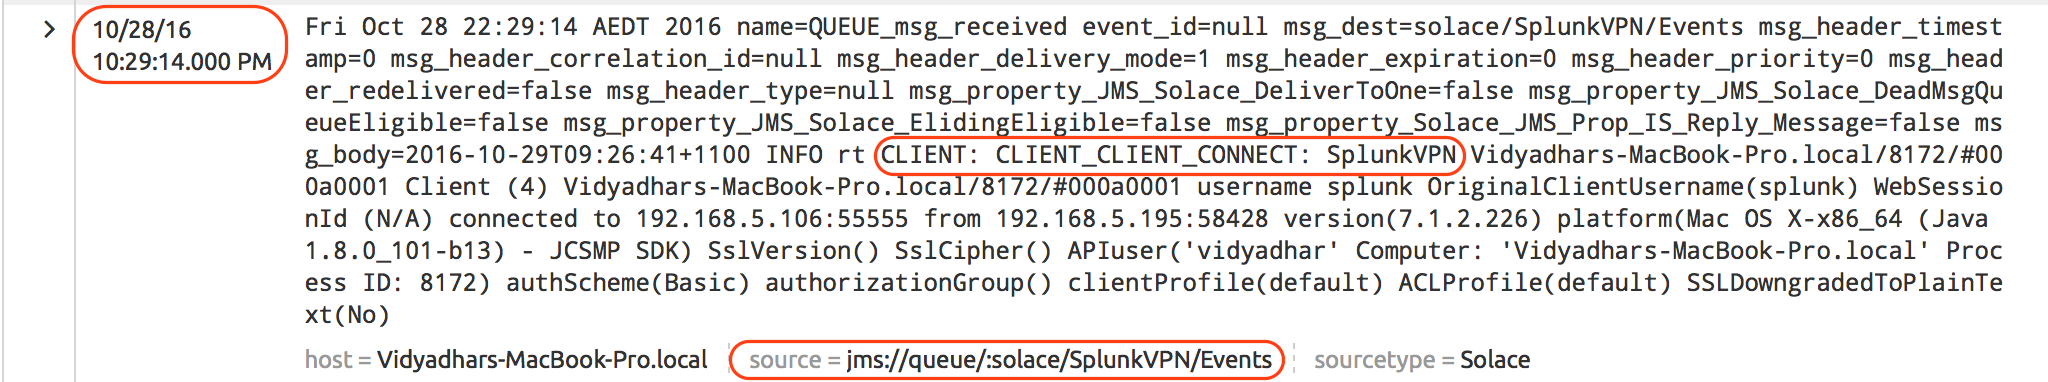
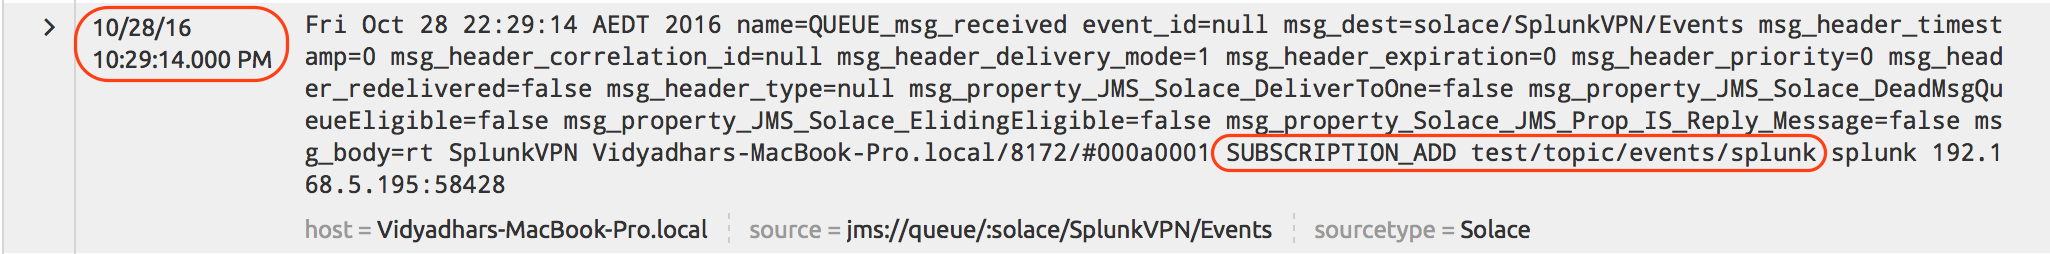
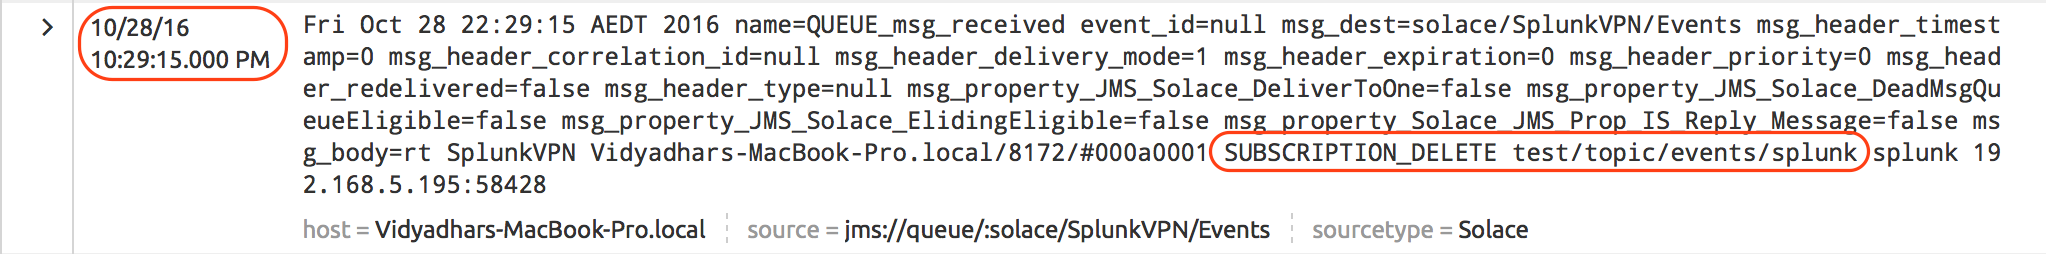
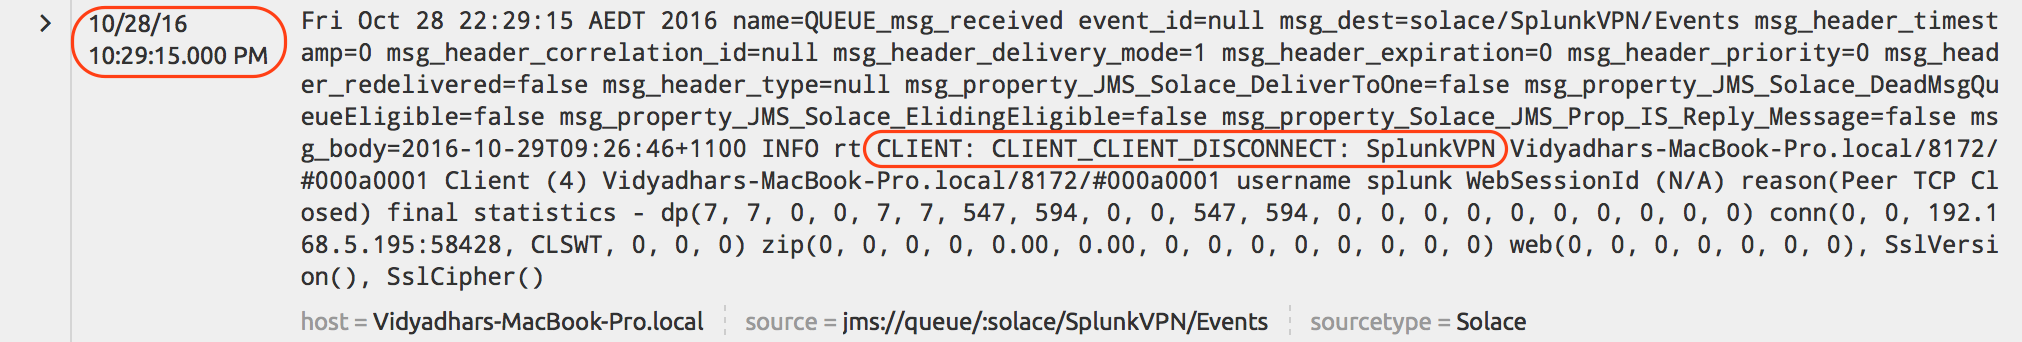
Above SDKPerf execution generated the events in following sequence and we should be able to see those events in Splunk search results on “Solace” index.

Go to Splunk Search and enter new search query index=”solace”. You should see Solace Events in the search results.
If you don’t see any data through the search as explained above, then debug in following order:
- Ensure that you have Enabled (i.e. started) JMS Messaging Data Input we configured above
- Validate the client is bound to Events queue
- For detailed troubleshooting, refer to Splunk JMS Modular Input logs at
$SPLUNK_HOME/var/log/splunk/splunkd.log
Summary and Next Steps
We saw how easy it is to integrate Splunk with Solace using JMS. We used simple example of ingesting Solace Event logs into Splunk for the sake of brevity. However, it proves central premise of integration with Splunk. We can extend this integration for Business Event monitoring requirements as well. For example, within Financial Services, we could potentially “Wiretap (using Topic-to-Queue bridge)” business flows such as Payments Transactions, Trade Order Management & Settlement flows, Client facing channel interfaces such as Web and Mobile Click Stream and the list goes on. The “Wiretap” feature has immense potential to open up the data already flowing on the message bus (data river) without affecting existing business transactions and seamlessly ingesting them into both data-at-rest (e.g. HDFS) and data-in-motion (e.g. Splunk) analytics systems (data lakes).
There is another way to ingest Log & Monitoring data into Splunk and that is using Syslog. Solace Messaging Router generates Syslog messages, as defined in RFC 3164 to record events that occur within the platform. We can configure Solace Router to emit these events to a configured Syslog server. Splunk Syslog Forwarder is an easy channel (Data Input) to ingest this information into Splunk. Using Syslog to ingest monitoring events into Splunk is recommended compared to ingesting this information using JMS.
References
All of Solace documentation is accessible from the Solace developer portal. You are encouraged to check them out for further information and details.
Explore other posts from category: DevOps


Subscribe to Our Blog
Get the latest trends, solutions, and insights into the event-driven future every week.