Logstash is a free and open source server-side data processing pipeline made by Elastic that ingests data from a variety of sources, transforms it, and sends it to your favorite “stash.” Because of its tight integration with Elasticsearch, powerful log processing capabilities, and over 200 pre-built open-source plugins that can help you easily index your data, Logstash is a popular choice for loading data into Elasticsearch.
I will share here the steps needed to connect Solace PubSub+ with Logstash as a log storage component. For this demo, I’ll be using a Solace PubSub+ Event Broker and a Logstash server. I’ll use dummy log entries instead of real application logging for now. I will set up a Logstash server in my Google Cloud Platform and use Solace PubSub+ Event Broker: Cloud to host my event broker.
Solace PubSub+ Event Broker: Cloud
It’s free to run a Solace PubSub+ Event Broker on Solace PubSub+ Event Broker: Cloud. Just go to https://console.solace.cloud/login/ and set up your own instance, then create a new event broker on AWS with a few clicks as shown here.
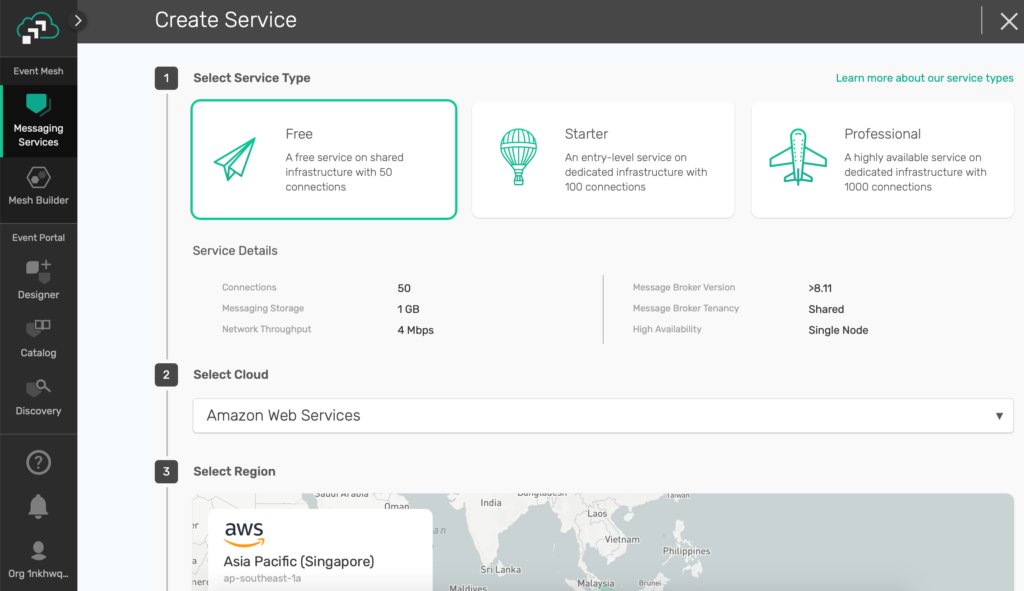
Figure 1 Create your Solace PubSub+ Event Broker
Don’t blink! No need to go and make a cup of coffee. Your broker should be ready now.
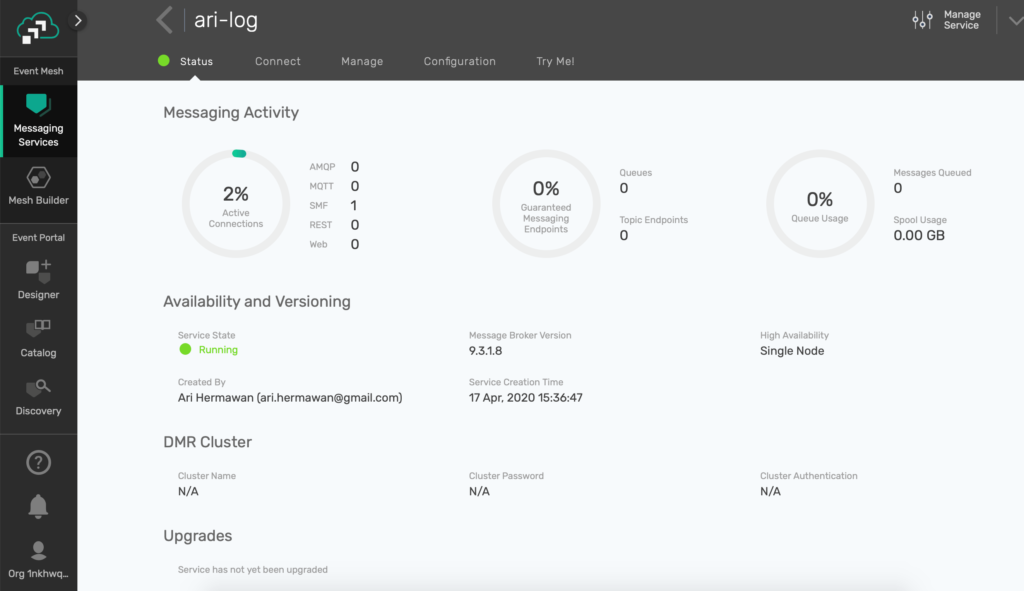
Figure 2 Your shiny new event broker

Figure 3 Connection information
Leave it at that and set up the Logstash server next.
Logstash Server (ELK Stack) on Google Cloud Platform
For the Logstash server, I’m using a Bitnami ELK image readily available from Google Cloud Platform Marketplace.
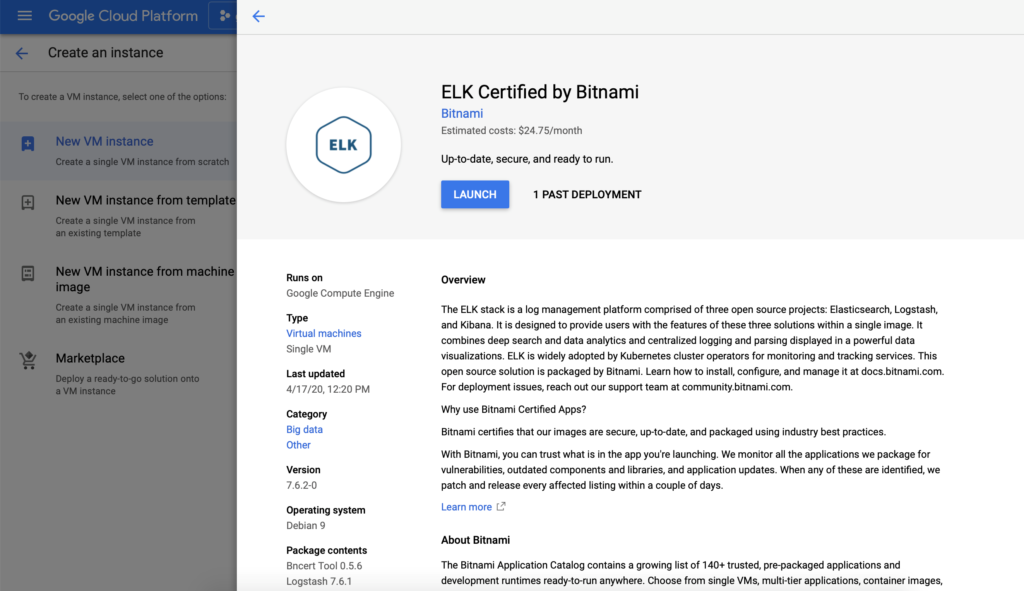
Figure 4 Set up ELK Server on GCP
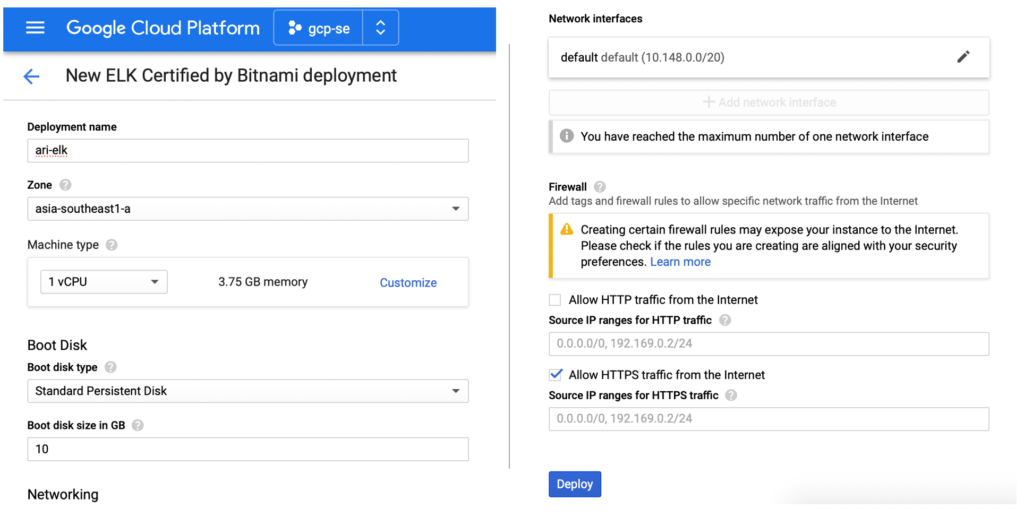
Figure 5 Configure the new ELK deployment
Once the deployment is done, you can log in to this new instance via SSH or gcloud or pick your favorite from the options available!
Download Solace JMS API
The first thing you need to do is download the Solace JMS API Library to this server. This library will be used by Logstash to connect to Solace PubSub+ using JMS API. You can put the library anywhere, but for this demo I will create folder /usr/share/jms and put all the JAR files underneath.
You can download the Solace JMS API Library. For this demo, I use wget to download the library directly into the server.

Figure 6 Download the Solace JMS API Library
Once you have the zip file of the Solace JMS API Library, you can extract and copy the JAR files under lib/ directory to our /usr/share/jms folder. You will use these libraries later on when we configure the JMS input for Logstash.

Figure 7 Copy the JAR files
Reset Kibana User Password
You will also use the Kibana dashboard later on to verify that your log entries can be processed correctly by the Logstash JMS input. For that, change the user password with your own password and restart the Apache web server to apply the new setup.

Figure 8 Change ELK default password
Once you’ve restarted the Apache web server, log in to the Kibana by accessing /app/kibana from your web browser.
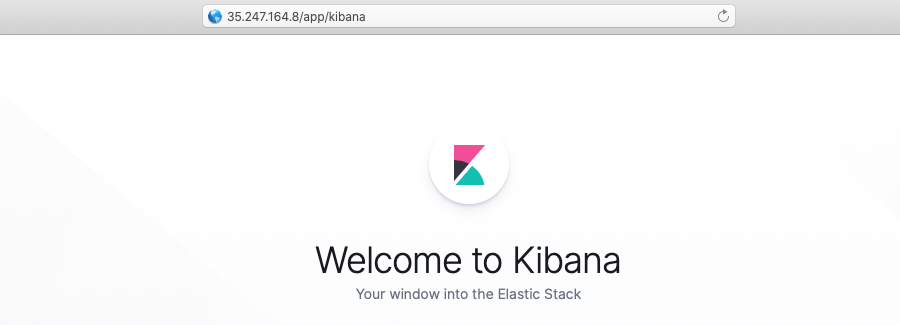
Figure 9 Test the new Kibana password
Prepare the Logstash Queue
Next you’ll configure Logstash to consume from a Queue to have a guaranteed delivery of log events to Logstash. To do that, go to the Solace PubSub+ Broker Manager by clicking the Manage Service link on the top right corner of your service console.

Figure 10 Manage the event broker
To create a new Queue, simply go to the Queue menu on the left and click the green Create button on the top right. Give any name you want but remember you will use this to configure the Logstash JMS input later on. For now, name it LogstashQ.

Figure 11 Create a new Queue
Keep all the default values for this demo as I will not go into details around Queue for this demo.
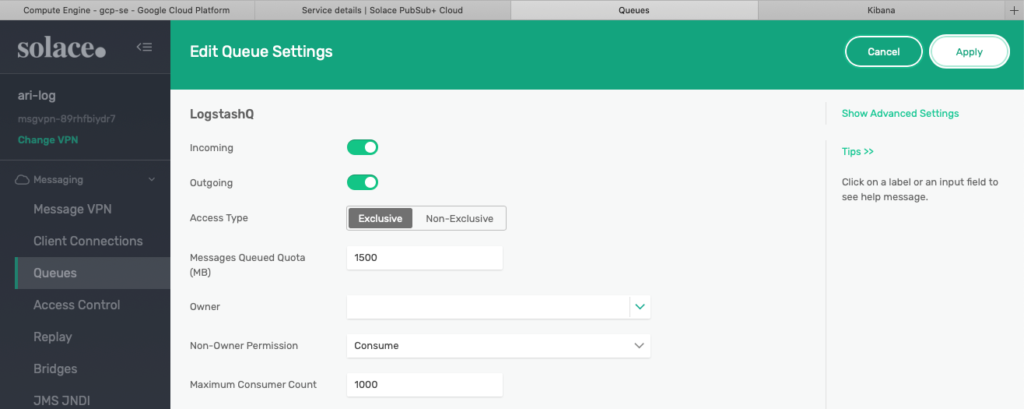
Figure 12 Use the default values for the new Queue
Topic to Queue Mapping
This is a very important part of setting up the Queue for our log flow, in which you will make configurations for the Queue to subscribe to the topics that we want to get and later be consumed by Logstash. For this step, go to the Subscriptions tab menu and click the + Subscription button on the top right.

Figure 13 Add subscription to the new Queue
Now, you want to attract all events related to the logs in the Acme enterprise. For that, add a topic subscription with a wildcard after the acme/logs/ hierarchy. You can also have multiple different subscriptions for this Queue if we wish.

Figure 14 Add acme/logs/> subscription
Test the Log Queue
To make sure the mapping is correct, try to publish a fake log event via the Try Me! tab on the service console. Connect both the Publisher and Subscriber components and add acme/logs/> subscription in the Subscriber section.
Now test by sending a dummy log entry line as the Text payload of the test message, and verify that the message is successfully received by the Subscriber component.
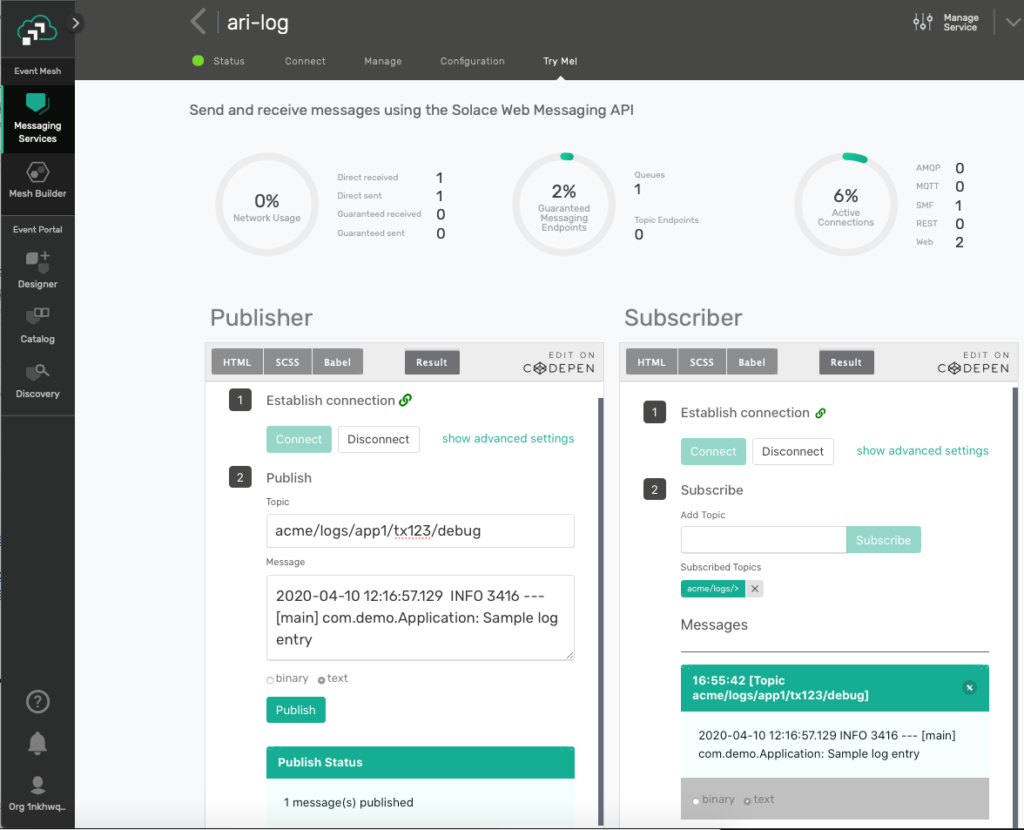
Figure 15 Test Publishing a Sample Log Line
Now go to the Queues and into our LogstashQ. Verify that the same message is also safely queued in this queue via the Messages Queued tab.
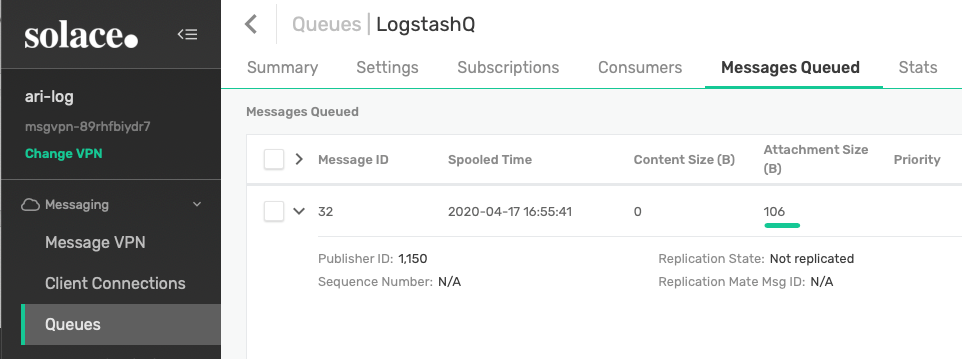
Figure 16 Log event queued in the new Queue
JNDI Connection Factory
We will be using a JNDI-based connection setup in the Logstash JMS input later on. For that, let’s verify that you have a JNDI Connection Factory for that use. Solace PubSub+ Event Broker comes with an out-of-the-box connection factory object that you can use, or you can create a new one if you want by going to the JMS JNDI menu and Connection Factories tab.
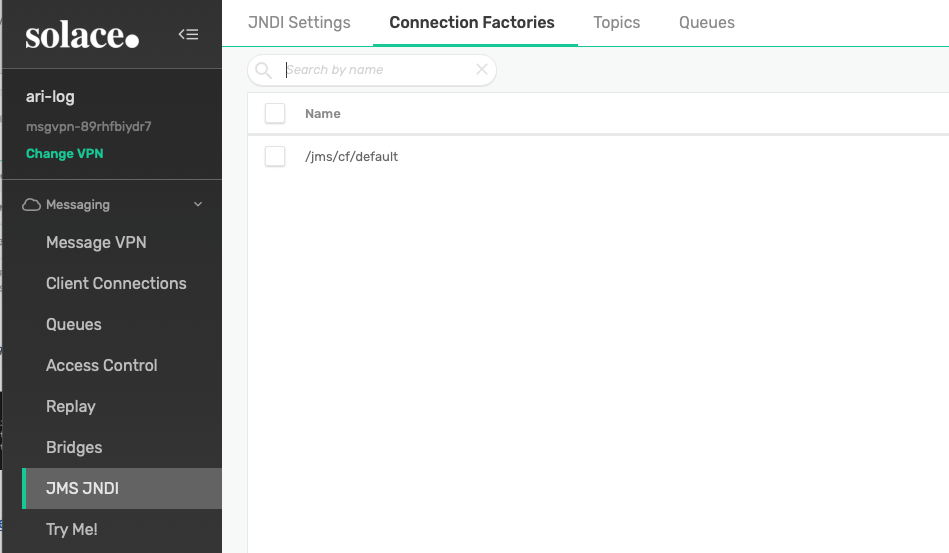
Figure 17 Verify JNDI Connection Factory
Configure Logstash
This Logstash configuration follows the samples already created by the ELK stack image from Bitnami. However, your environment might vary.
Go to /opt/bitnami/logstash and add a new JMS input section to the existing configuration file under the pipeline folder.
root@ari-elk-vm:~#
root@ari-elk-vm:~#
root@ari-elk-vm:~#
root@ari-elk-vm:~# cd /opt/bitnami/logstash/
root@ari-elk-vm:/opt/bitnami/logstash# vi pipeline/logstash.conf
root@ari-elk-vm:/opt/bitnami/logstash#
Please refer to the Elastic documentation for JMS input plugin for more details. I have created the following configuration as per my newly created Solace PubSub+ Event Broker and the Logstash queue earlier.
Since we are going to consume from a queue, you need to set the pub_sub parameter as false. Pay attention to the jndi_context parameters and make sure you have the correct information based on the connection information seen in PubSub+ Cloud service console earlier.
If you’re not familiar with Solace, pay attention to the principal argument where you need to append ‘@’ followed by the Message VPN name after the username.
input
{
    beats
    {
        ssl => false
        host => "0.0.0.0"
        port => 5044
    }
    gelf
    {
        host => "0.0.0.0"
        port => 12201
    }
    http
    {
        ssl => false
        host => "0.0.0.0"
        port => 8080
    }
    tcp
    {
        mode => "server"
        host => "0.0.0.0"
        port => 5010
    }
    udp
    {
        host => "0.0.0.0"
        port => 5000
    }
    jms {
        include_header => false
        include_properties => false
        include_body => true
        use_jms_timestamp => false
        destination => 'LogstashQ'
        pub_sub => false
        jndi_name => '/jms/cf/default'
        jndi_context => {
         'java.naming.factory.initial' => 'com.solacesystems.jndi.SolJNDIInitialContextFactory'
         'java.naming.security.principal' => 'solace-cloud-client@msgvpn'
         'java.naming.provider.url' => 'tcps://yourhost.messaging.solace.cloud:20290'
         'java.naming.security.credentials' => 'yourpassword'
        }
        require_jars=> ['/usr/share/jms/commons-lang-2.6.jar',
                        '/usr/share/jms/sol-jms-10.8.0.jar',
                        '/usr/share/jms/geronimo-jms_1.1_spec-1.1.1.jar']
    }
}
output
{
    elasticsearch
    {
        hosts => ["127.0.0.1:9200"]
        document_id => "%{logstash_checksum}"
        index => "logstash-%{+YYYY.MM.dd}"
    }
}
By default, the ELK image from Bitnami does not do auto-reload of the Logstash configuration. In that case, we can restart the Logstash service using the built-in ctlscript.sh script. Check the logstash log after that to make sure that it has successfully connected to our Solace PubSub+ Event Broker. The log should have similar entries as shown below.

Figure 18 Logstash log with JMS input
Also verify that the Logstash connection exists in our Solace PubSub+ Broker Manager, via the Client Connections menu and Solace Clients tab.

Figure 19 Verify the Logstash connection exists
Since you have already tested on sending a fake log entry earlier, by now the Logstash JMS input should have already consumed that message. Verify that by going into the LogstashQ and check the Consumers tab, where you’ll want to look at the “Messages Confirmed Delivery” statistic and make sure the number has increased.

Figure 20 Verify Messages Confirmed Delivery
Create Kibana Index Pattern
To be able to see the log entry in the Kibana dashboard, create a simple index pattern of logstash-* and use the @timestamp field as the time filter.
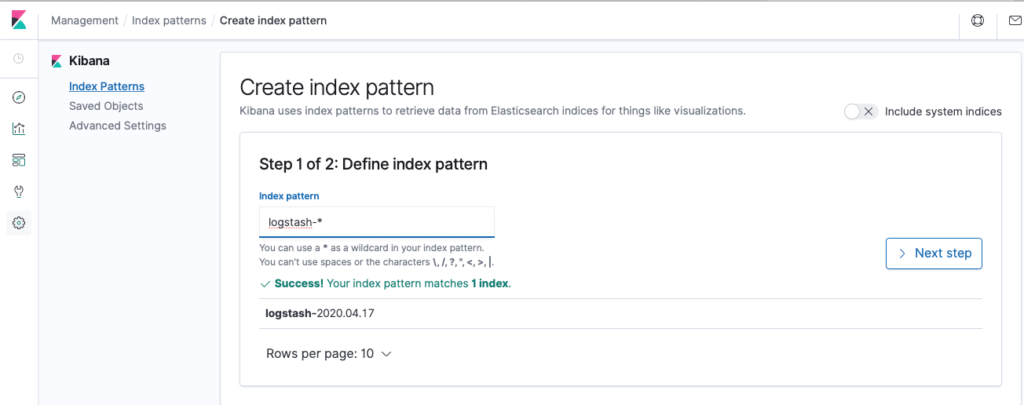
Figure 21 Create a new index pattern in Kibana
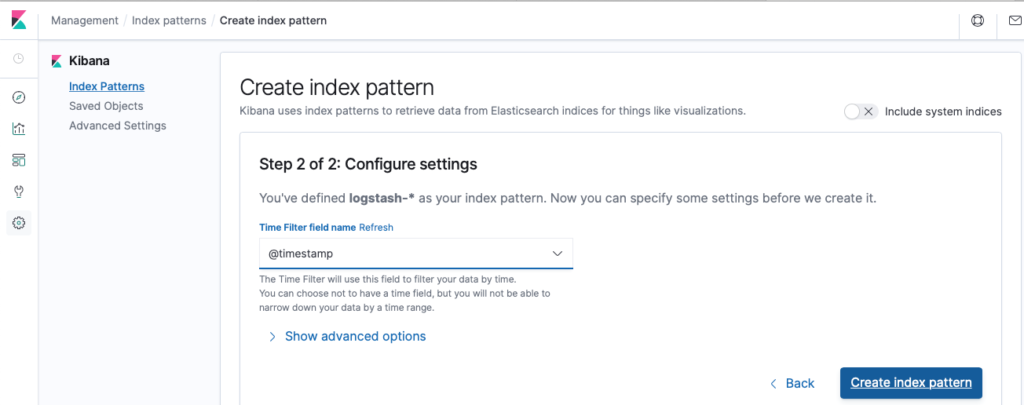
Figure 22 Use @timestamp as the time filter
You can now go back to the home dashboard and should see an entry exists there from the dummy log event. And that’s it! Now you should be able to stream log events by publishing to a PubSub+ topic like acme/logs/app1/tx123/debug, for example.
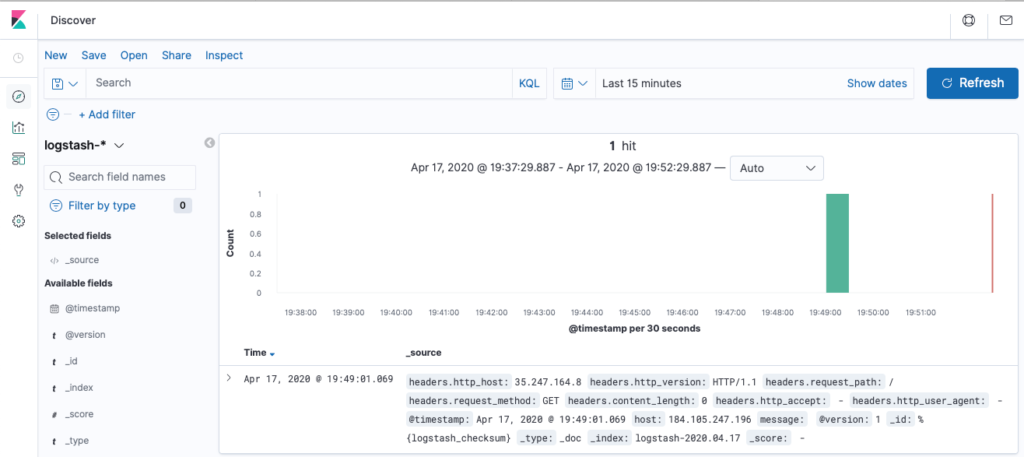
Figure 23 Verify the log entry shows up in the Kibana dashboard
Summary
So that’s how to integrate Solace PubSub+ Event Broker with Logstash. There are a lot of other stacks that Solace can integrate with as well. Check them out!
Explore other posts from category: For Developers

 Ari Hermawan
