This is the first in what will become a series of posts introducing our SolAdmin management application. These posts will take quick tours of key capabilities and features of the SolAdmin application and how to put these features to use monitoring Solace appliances so that you can get the most out of your applications that depend on Solace’s unified messaging platform.
If you’re new to SolAdmin, it’s a management application that can be used to access all management features of Solace appliances. It is designed for both advanced administrators already familiar with Solace and those just getting started.
This video demonstrates the monitoring of subscriber applications receiving messages from a Solace messaging appliance. My goal was to show how easy it is to take a typical problem of an application that is not correctly receiving messages and to show both how the appliance provides detailed statistics and debug information that help to diagnose the problem and how SolAdmin makes it very easy to access these details. Here’s a brief summary of what I covered:
In general applications having issues receiving messages can be divided into these categories:
- The application’s network connectivity to the message broker has issues.
- The application is simply consuming messages too slowly. I.e. the application is back pressuring the message broker and needs to be streamlined.
- The application may be hung.
- The message broker may be overloaded.
Initially when debugging this issue it might not be immediately obvious which of these reasons is being seen and furthermore it is often different teams that are responsible to fix the issue. So being able to determine the real reason the application is misbehaving is very useful.
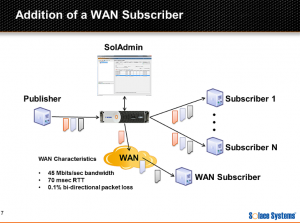
To demonstrate this, the video starts with a look at a typical publish subscribe message flow with a single publisher sending messages to the Solace appliance. The messages are then fanned out to several subscribing applications. SolAdmin is used to explore the details of the receiving clients and plot the real time message flow towards these clients and look at the TCP/IP details of each client.

Explore other posts from category: DevOps

 Mark Spielman
