If you use a message broker as a communication backbone for your enterprise applications and have had issues caused by a few slow consuming applications, then this is for you. I wrote a quick LinkedIn post about this when a friend asked me what’s so different with how Solace PubSub+ deals with slow consumers. I figured the best way to show this is by doing a quick demo with more than 50 GB messages queued in the broker due to slow consumption. But I want to show more of that demo here, so I can easily refer it back should someone ask me the same question again.
Event brokers are considered infrastructure. We don’t want infrastructure to keep us up at night worrying that we’ll need to force a restart and purge tens of gigabytes of customers’ transactions because some downstream applications slowed down or the traffic just spiked due to some new marketing promotions.
With this blog post I will explain and show how Solace PubSub+ Event Broker keeps on working as expected in the event a consumer slows down or fails so other applications connected to the broker are not affected. I will also show that a large number of pending messages will not impact the fail-over time needed for Solace PubSub+ Event Broker.
The Setup
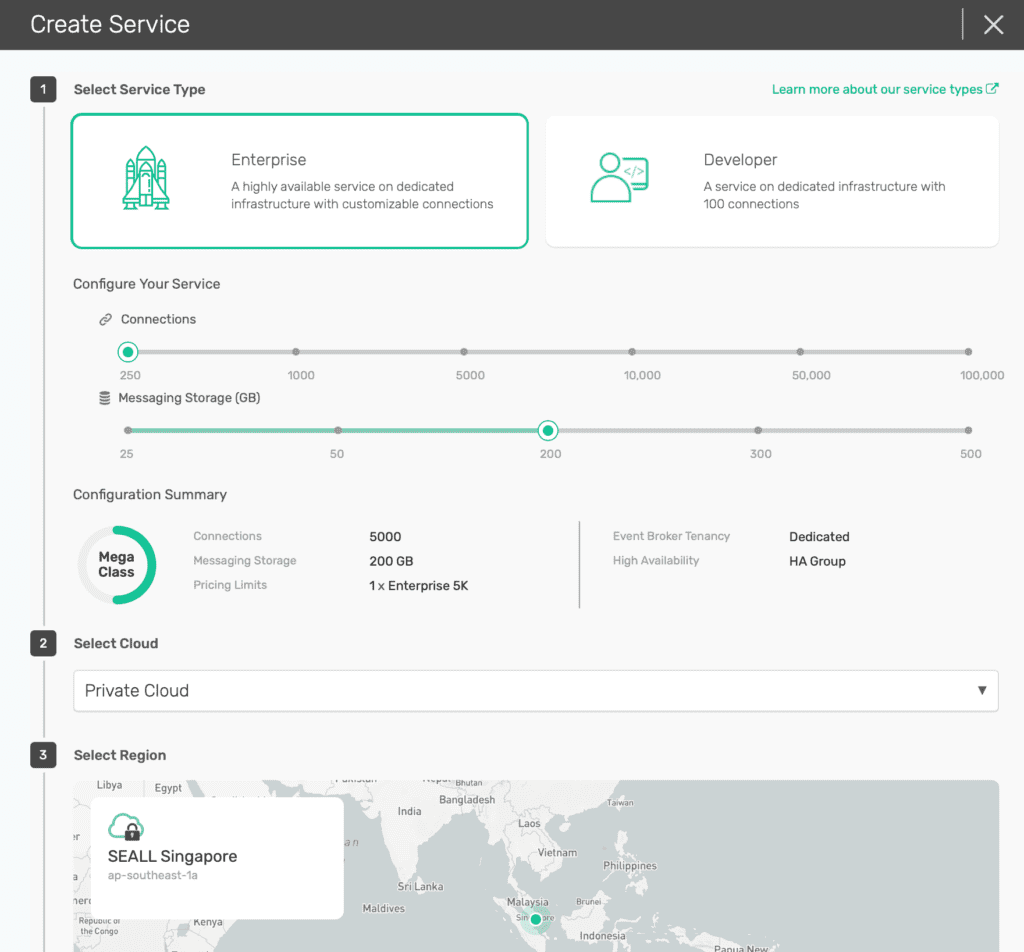
For this demo, I’m using Solace PubSub+ Cloud simply because it’s the quickest way to go. It literally just took me just few clicks and I only needed to type the broker name. Of course we can set it up using the software on many other platforms if you so wish. The brokers are deployed on AWS and run on m5.xlarge EC2 instances. This is because the environment I’m using is not using the most recent and highly recommended Kubernetes-based deployment.
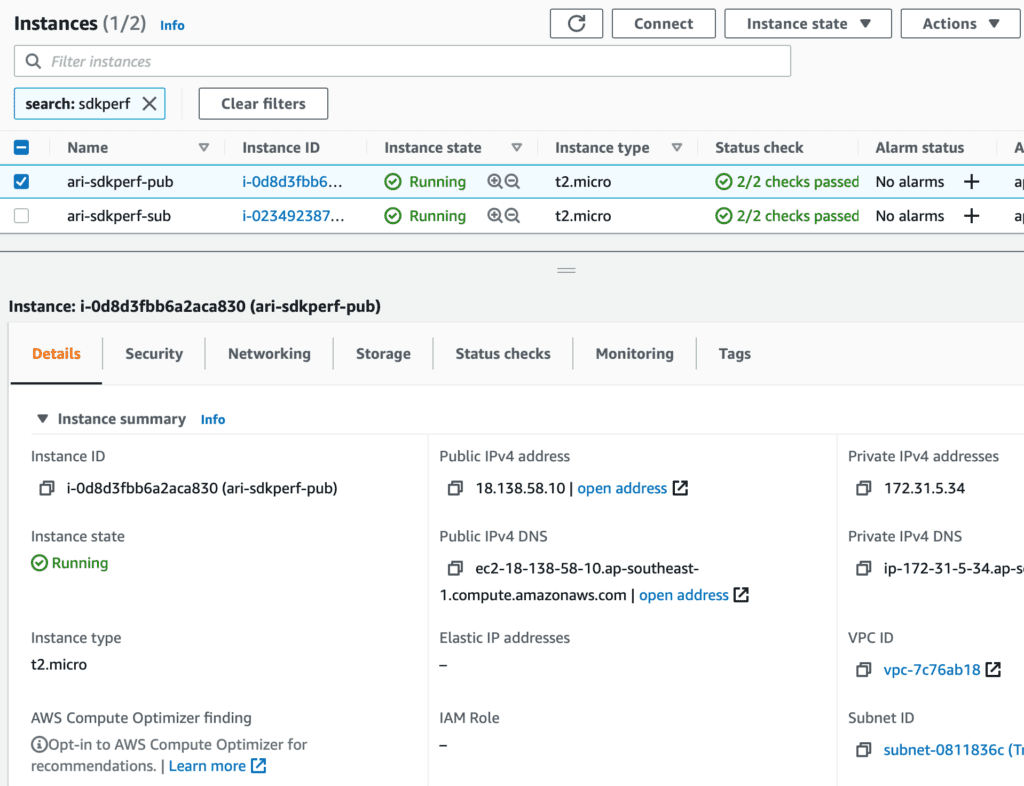
For the applications, I’m using SDKPerf to simulate the producers of events and the few differently paced events consumers, running on two t2.micro instances.

Figure 1: Create Solace Cloud service

Figure 2: SDKPerf EC2 instances for publishers and subscribers
The Test
Here I’m going to simulate a situation where a broker is serving multiple applications and some of these applications are slow and unable to keep up with their respective incoming traffic. You will be able to see that the broker and the other applications will not be impacted by the slow consumer.
I created three queues, each having different topic subscriptions. If you are not familiar with this concept, just consider that we have different queues with different incoming traffic. You can also take a look at a tutorial on this concept.

Figure 3: List of Queues

Figure 4: The first queue and its subscription

Figure 5: The second queue and its subscription for slow consumer test

Figure 6: The third queue and its subscriptions for a very slow consumer test
I have ten producers sending around up to 10,000 messages per second with a payload size of 1 KB to four different topics, which were then spooled or written into the three different queues we had created earlier. This is because we want to test the spooling or storing of the messages while the designated consumer applications can’t keep up with the pace to immediately process the incoming messages.
In normal condition, all three queues will not have many unprocessed messages at any time because all the consumer applications are able to catch up with the incoming traffic. In this case, the first test queue steadily flows messages in and out to its consumer.

Figure 7: Queue 1 with a consumer fast enough to keep up with incoming traffic
The second queue consumer is a rather slow consumer that is only able to process around 800 messages per second, which is around half of the incoming traffic rate. This means there are a lot of messages waiting to be consumed in this queue.

Figure 8: Queue 2 with a consumer capable of processing only half of the incoming traffic rate
The third queue has a much slower consumer, which can only take one message for every 10 seconds. Consider this as a sample of a normal application that suddenly has a problem and is almost unable to process any messages.

Figure 9: Queue 3 with a very slow consumer
As you can see here, the fast queue consumer is not affected by the other slow consumers. You should see some network limitation based on your environment setup, but the broker maintains good service level for the healthy consumers while keeping spooling messages for the slow consumers to process later on.
Note: This test was using a single t2.micro AWS EC2 instance to run all three consumer applications, and they are likely to hit the network bandwidth capacity of the instance.
Conclusion
The key point to show here is that any healthy consumer will not be affected by the other slow consumers and piling-up messages in the other queues. The Solace PubSub+ Event Broker maintains the service for the other clients while isolating the slow consumers. Compare this to other brokers that will slow down entirely, or even crash due to the building pressure and large spool size. If your broker slows down when messages start piling up due to a slow consumers, take a stab with this free broker.
Solace Named an Event Broker LeaderIDC MarketScape positions Solace in the Leaders category for worldwide event broker software.
Bonus Point: Safe, Predictable Failover
When the pile gets way too big, a broker may struggle even to fail-over to its standby/backup broker because the other broker needs to ‘load’ the pending messages before it can start taking new traffic. This usually forces administrators to reset the broker to zero pending messages to allow instant start-up and resume operations. The nice thing with Solace PubSub+ Event Broker is that it will take linear time of fail-over regardless of how big the pending messages pile is. I’ll demonstrate that by stopping the primary broker EC2 instance and see what happens.

Figure 10: The SDKPerf client lost connection after the primary broker shut down.

Figure 11: SDKPerf client got back connection on the 9th attempt of 1 second interval.

Figure 12: Immediately back to business with 50 GB pending messages
Above is the log from the SDKPerf client who is able to resume operations after 9th attempt to reconnect with a 1 second interval. It immediately has access to the same 50 GB messages pending earlier. This is simply because the standby broker keeps its own copy and always be ready to take over and not having to read the data of the primary broker when it’s time for it to take over activity.
I have also recorded this demo as a video for easier and more complete view of the action.
If you like it, give it a try from solace.dev and head over to the Solace Developer Community for any help needed or to share your quick wins!
Explore other posts from categories: For Architects | For Developers

 Ari Hermawan
