
Solace Insights Supports Export to Leading APM Solutions
Event-driven systems are decoupled and asynchronous, which introduces challenges for observability. Solace Platform solves your visibility gap by enabling rich metrics, logs and traces combined with a visualization layer for performance monitoring and alerts.
- Export telemetry to your existing tools (e.g. operations centers and APM software) thanks to support for open standards.
- Gain complete visibility into real-time data movement across your hybrid and multi-cloud infrastructure without the operational overhead of managing it.
What can you do with Solace Insights?
ControlTake Control of your Event-Driven System
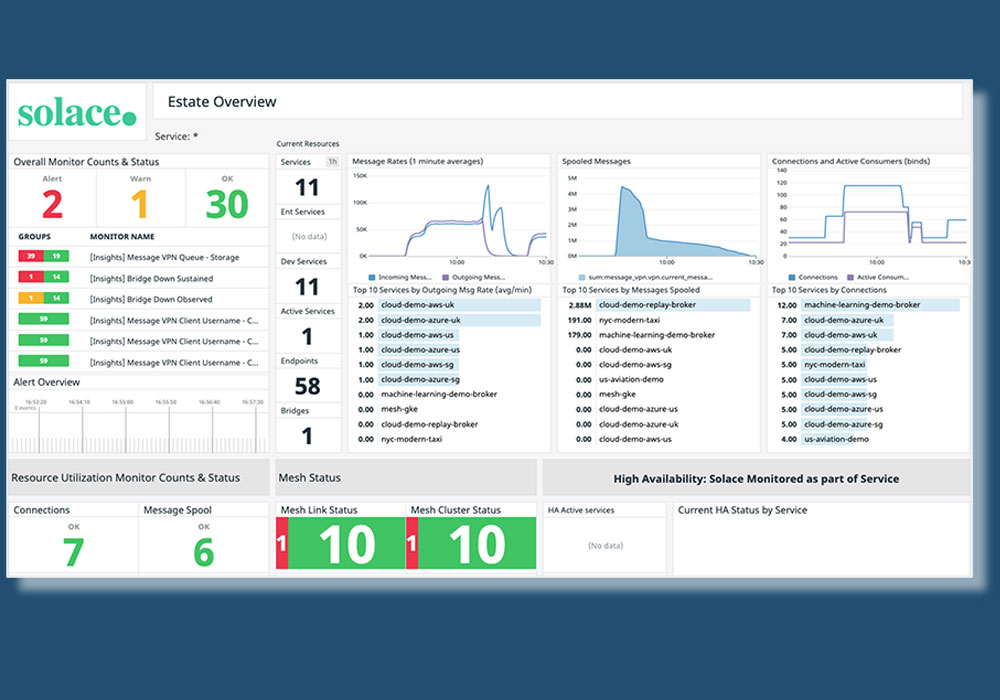
More quickly identify and fix issues across development and production environments thanks to monitoring and alerting that give infrastructure teams the complete toolset they need—without stitching together a bunch of products. Delivered as a cloud-managed service within Solace Platform, Insights eliminates the costs and operational burden of managing monitoring infrastructure.

Insights & GovernanceGain Insights and Improve Governance
Gain operational visibility across every Solace broker—appliance, software, and cloud—across all your clouds, datacenters and edge environments.
Understand exactly where data moves to support critical compliance and governance requirements, and export telemetry to third-party APM tools using the OpenTelemetry (OTel) standard so you can unify observability across your existing monitoring stack.

Distributed Tracing Trace from End to End
Capture end-to-end traces without instrumenting internal components. Events are tracked natively in the event brokers to eliminate gaps in visibility, including across partitioned queues and DMQs. Use trace data to pinpoint latency hotspots faster, accelerate root-cause analysis, and identify performance and cost optimization opportunities.
Why don’t most observability solutions
work with event-driven systems?
Learn why, and how to overcome these common challenges:
- Decoupling blindness — APM visibility typically stops at the broker, making it hard to tell whether latency comes from applications, the network, or the broker—leaving teams guessing at root cause.
- Asynchronous complexity — Non-linear, asynchronous event flows require advanced causality tracking; without end-to-end visibility, delayed or lost messages are difficult to pinpoint or prove.
- Fragmented tools — Separate dashboards for apps, brokers, and infrastructure increase operational overhead and slow root cause analysis, extending outages and raising costs.