 Logging is an important element of the application development process, but not always given the attention it deserves. As a developer, there are various types of logs that you will need to handle in the application such as: logs related to business events, operational conditions, user interaction, exceptions, debug logs, etc. In this blog post I will discuss logging related to Solace messaging and how to handle them effectively in your application.
I will present a general overview of application logging in the context of Solace messaging first, followed by other implicit and external logging facilities available in Solace. I will follow this up with another post with code snippets and config files to handle logging in the application.
This post assumes working familiarity with basic messaging concepts and Solace features. You are encouraged to visit the Solace Developer portal to familiarize yourself with Solace concepts.
To log or not to log, that is the question!
As with any other application, the question of what to log, how to log and how much to log in Solace applications is a subjective one. I will outline some recommendations for logging in Solace messaging context below. These should be considered along with existing guidelines in place in your project and application.
Choosing the right tool
Depending on the API, a number of frameworks and engines are available for logging. Java applications for e.g., can use Log4j, Log4j2, Logback, SLF4J, etc. In all likelihood, your team or project may be already using a framework and as a result, your options may be limited. Solace Java API uses Jakarta Commons Logging to support different logging frameworks, such as log4j.
Logging Levels
Almost all logging frameworks support logging levels; and use of the right level for logging can’t be stressed enough. Understanding the Solace philosophy to logging will help you align that with the logging you need from your application.
Since each framework defines logging levels of its own, Syslog logging levels are used for comparison. A brief description of each level is listed below along with how Solace SDKs use and map them.
- Emergency: The system is unusable and action must be taken immediately. This can be seen as global failure with severe consequences. Solace SDKs don’t use this level of logging.
- Alert: The system is unusable and action must be take immediately. Solace SDKs don’t use this level of logging.
- Critical: There is an unrecoverable error situation that should be corrected immediately. Solace SDKs use this, but use of this is rare and reserved only for the most dire of circumstances; such as a memory allocation failure or resource failure that will lead to instability or insanity.
- Error: Error conditions in the API. Solace SDKs use these to indicate any internal inconstancies not driven by application input or configuration.
- Warning: A condition that’s not an error condition as is, but may escalate into one if not attended to. (e.g.: message spool storage being filled up). Solace SDKs use this when the external inputs such as application configuration and user input, are invalid or inconsistent.
- Notice: An unexpected significant event or occurrence that does not affect the sane operation of the SDK or application. These don’t need any immediate action, but an analysis of this later may lead to some action. Solace SDKs use this to record significant events. Potentially repeatable events (e.g. connection refused) are logged at lower logging level.
- Info: Informational messages that don’t require any action to be taken. These are mainly logged for reporting, analysis, etc.
- Debug: Debug Level messages. This is useful for developers for troubleshooting and not useful during operations. This is the lowest level tracing in Solace SDKs.
Solace API Log levels
| Log Level | JMS | JCSMP | Java RTO | C | .NET |
|---|---|---|---|---|---|
| Emergency | NOT USED | ||||
| Alert | NOT USED | ||||
| Critical | FATAL | FATAL | SEVERE | SOLCLIENT_LOG_CRITICAL | Critical (2) |
| Error | ERROR | ERROR | SEVERE | SOLCLIENT_LOG_ERROR | Error (3) |
| Warning | WARN | WARN | WARNING | SOLCLIENT_LOG_WARNING | Warning (4) |
| Notice | INFO | INFO | INFO | SOLCLIENT_LOG_NOTICE | Notice (5) |
| Info | INFO | INFO | FINE | SOLCLIENT_LOG_INFO | Info (6) |
| Debug | DEBUG | DEBUG | FINEST | SOLCLIENT_LOG_DEBUG | Debug (7) |
What to Log
As an application developer using Solace SDKs, you should consider logging the following:
- Solace API events
- API exceptions
- Application state
- Debug logs
Solace events are sent by the API asynchronously to the application as they occur. For e.g., Solace API may be trying to restore lost connectivity between your application and the Solace message router. This would result in connection state events being sent to the application.
Solace API exceptions may be thrown when your application calls the Solace API. Which exceptions are thrown is dependent on the underlying conditions. For e.g., a JMS application may find the queue its trying to use not configured in JNDI store and hence the lookup failed. This would result in ‘javax.naming.NameNotFoundException’ thrown to the application.
An Application state is an application defined condition that you wish to log mainly to help troubleshooting and communicating. For e.g., you may want to identify and log your consumer application state when it is successfully connected, first message is consumed, etc.
Debug logs are, for most part are for consumption by developers and will leave it to your liking.
What not to log
Not everything that’s available is worth logging. More logging doesn’t necessarily lead to better insights. Here are some potentially “high overhead” logging situations that you should avoid or log in the correct severity so it can be turned off in environments like Production.
- Logging per message. Whether you are doing a message dump, header parsing, etc., avoid logging each and every message. This can overwhelm the logging system on high traffic applications and may not yield much value. Instead, evaluate the message header or body and log only “interesting” occurrences.
- Logging in message callbacks: Avoid heavy evaluation and logging in message handlers in asynchronous message listeners. This can hurt the consumer throughput if it delays the message acknowledgement.
Application Logging considerations
Most projects and application teams have some guidelines in place for logging. Here are some additional guidelines related to Solace messaging that you should consider.
- If not already provided by the logging framework, include a timestamp in each log with sufficient resolution. For e.g., depending on your message frequency, you may want to use millisecond or even microsecond resolution for your logging timestamp.
- Include information that can trace the log to the source. A combination of identities such as application name, host name, client-user name, etc. can be used for this purpose. Although this information may seem redundant for a single application, many customers aggregate logs from several applications across several servers. Unique source identifiers are key to associating the logged event to the source.
- Check Solace message router capabilities if you are working with heterogeneous systems (e.g.: Solace message routers running different SolOS releases, working in an environment that mixes Solace hardware and software routers, etc). Log when the capabilities your application requires are not available (e.g.: flow creation, subscription management) on the Solace message router.
- A connection or session error can happen due to a network issue, an application or Solace message router misconfiguration, an authentication error, etc. This can happen during the initial connection attempt or after successful a connection. Logging these errors is useful for application troubleshooting as well as infrastructure troubleshooting.
Publisher application
The Solace API sends several exceptions and events to publishers that may be useful for the publisher applications to log.
- ACL rule declined: The destination that the publisher is trying to publish to is not allowed by the client’s ACL profile.
- JNDI look up failure: Destination lookup in JNDI store failed.
- Document too long: The size of the message being published exceeds the maximum supported size for the transport.
- Session Errors: The connection or session has been closed incorrectly or is in an invalid state when trying to publish.
- Capability mismatch errors: Publisher is attempting to access a Solace message router feature that’s not available (e.g.: trying to publish persistent message to a Solace message router with no ADB).
Guaranteed publisher
Persistent (guaranteed) publishers should log the publisher events such as the following:
- Spool quota exceeded: The endpoint (Queue / Durable Topic Endpoint) has exceeded its quota and the published message could not be persisted and was discarded.
- Endpoint shutdown: The endpoint is administratively shutdown and the published message was discarded.
- Endpoint not defined: The endpoint is not configured on the VPN.
Consumer application
Consumer applications should also handle Exceptions when interacting with Solace.
- Asynchronous Connection errors: In addition to the connection and session errors discussed above, if your application is an asynchronous message listener, you should also handle asynchronous connection errors. These will be discussed in a subsequent blog post <link>.
- If your application is a persistent consumer (using guaranteed transport) with explicit client acknowledgement, it may be useful to track and periodically log the number of unacknowledged messages (messages pending to be acknowledged). Though this is tracked on the Solace message router, having the “application view” of this statistics helps track “slow to acknowledge” consumers, especially when multiple consumers are bound to the same endpoint.
- If message headers or contents need to be logged in a consumer application, it is recommended to log it with unique ID. Here are some options for such unique ID.
Application assigned ID: As the name suggests, this is generated by the publisher application and populated in custom message header of the message. This is the method for generating a unique ID since your application has complete control over it.
JMS Message ID: This is automatically generated by the API and populated in the JMS header of the message. In the absence of an application assigned ID, a JMS Message ID can be used as a unique ID. In a mixed API environment (JMS + non JMS) care should be taken to populate the equivalent headers from non JMS APIs.
AD Message ID: This is automatically generated by the Solace guaranteed messaging system, but it’s not guaranteed to be unique per message. For e.g., a retransmitted message on a non-exclusive queue will have different AD Message ID than the original message. Also, this applies only to persistent messages and is not always exposed to the application. For these reasons, AD Message ID is not recommended to be used as unique ID.
Beyond Application Logging
In addition to the application instrumented logging discussed above, Solace also provides API logs that detail API activities and Solace message router logs that provide a “Solace message router view” of your application and VPN. These logs are provided to you with no additional coding effort, but can be very valuable during troubleshooting.
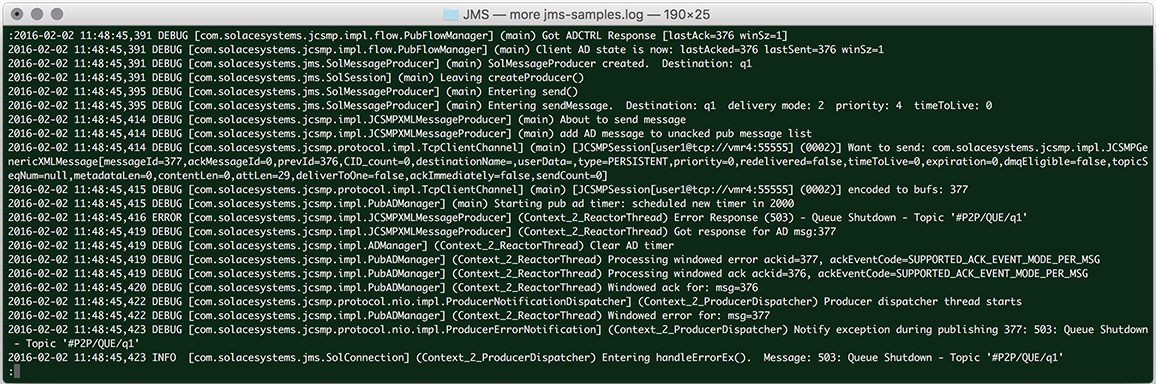
Solace API Logs
All Solace APIs have implicit logging through natively supported language features and extensions. For instance, Solace JCSMP API uses Log4J and C API uses logging event callbacks. These are generated automatically and depending on the application logging configuration, they are logged to console, file etc.
Solace message router Logs
The logs we have discussed so far are all generated on the application host either explicitly (application instrumented) or implicitly (API generated). Apart from these, Solace message router also has its own set of logs such as event logs, command logs, debug logs, etc. These logs are global in scope and usually managed centrally by middleware or system administrators. The Solace message router event log in particular, provides a “Solace message router view” of your VPN activities. This can augment your understanding when used along with the application and API logs during troubleshooting. Please refer to Monitoring events using syslog in the Solace message Bus Management document for details of the event log format and how to parse special events (like client disconnect events).
If the default Solace message router logging timestamp is not precise enough, you can enable millisecond timestamp for logging on the Solace message router. Please check the steps in Configuring Event output and thresholds for steps.
Until next time …
So far, we have covered essential background for application logging, logging facilities available in Solace and considerations for logging in different types of Solace messaging. I will follow this up with another post with details on handling them in specific APIs. I will leave you with the following links to explore until next time …
Explore other posts from category: DevOps


Subscribe to Our Blog
Get the latest trends, solutions, and insights into the event-driven future every week.