Solace Enterprise Stats is a new solution from the Solace Professional Services Group that enables easy access for monitoring your Solace message routers. In this blog article, I will walk you through the architecture and some of the details underlying the Enterprise Stats solution.
An Enterprise Stats deployment always consists of at least one instance of the StatsPump and at least one Stats Receiver. In the diagram below, we have a simple deployment model for the Enterprise Stats solution.
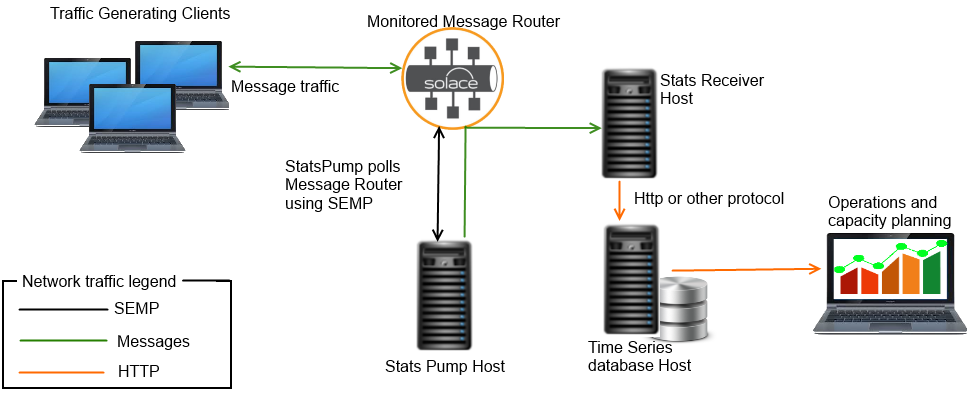
In this diagram, the StatsPump is polling a Solace message router using the SEMP protocol. It then re-formats the SEMP responses it receives from the message router, and publishes the stats back out as messages using the very same message router. Also in this picture, a Stats Receiver is subscribing to some statistical data and writing it into a time series database. From there, an operations GUI is pulling the data for visualization.
In this blog post, we will examine the problems this tool solves, take a closer look at how it works, and the options available for customization. If you haven’t done so already, ensure you are familiar with Solace core concepts and check out our Introduction to Enterprise Stats.
We will look at:
- Steps to start using Enterprise Stats in your organization.
- The solution architecture.
- The different types of stats that are available.
Steps to Using Enterprise Stats
If you have Solace message routers running in your enterprise and would like to begin using the Enterprise Stats solution, the following steps will get you up and running as quickly as possible:
- Acquire the Enterprise Stats packages. Talk to your Solace sales rep for details.
- Plan your deployment model: how many routers are to be monitored? How many instances of the StatsPump will be required to support your global infrastructure? How many receivers will be required? What data destination(s) are you planning to use? Do you need to visualize the data? If so, what tool are you using, or plan to use, for visualization? The Solace Professional Services Group can assist you with all of this planning and execution when you purchase the solution.
- The solution comes with an InfluxDB Receiver Plug In. If you plan to use a different data storage product, you will need to write a custom Receiver Plug In. The Solace Professional Services Group can assist you with task if you like, or you may do this yourself. A future blog post will detail how to write your own receiver plug in.
- Develop desired visualizations. Solace has sample Grafana dashboards available as a starting point for visualizing Enterprise Stats data stored in InfluxDB, and can assist you in planning and creating any more that you require.
- Plan your data’s lifecycle. How long will you store it? Do you need to roll up any information for longer term storage? The Solace Professional Services Group can help you plan and execute your data lifecycle.
The Value of this Architecture
The Enterprise Stats solution architecture makes collecting stats about your Solace message routers as easy and powerful as possible. In the Introduction to Enterprise Stats we outlined who needs this solution. The following points examines why and how.
- Obtaining Stats from a Solace message router requires using Solace’s powerful SEMP protocol. Because of this interface’s power and breadth of scope, there is a significant learning overhead to master it. Using Enterprise Stats removes this overhead and lets you simply receive nicely formatted stats messages in minutes. The StatsPump does the heavy lifting of efficiently and nimbly handling schema controlled XML data, and makes it much more easily digestible for end consumption. Since the data is still going through the schema based checks as it passes through the StatsPump, applications can rapidly consume the data using much more lightweight and simple data handling, confident that the data conforms to well know rules enforced in the StatsPump.
- If your organization has multiple needs for stats such as operations, capacity planning and various application teams, you can easily end up with a collection of custom written applications all polling the same message routers. This creates unnecessary load on the message routers, and is inefficient with network traffic due to the weight of SEMP data. Using Enterprise Stats allows your solution to lean on the message router’s messaging capabilities for fanning out stats to multiple consumers. Once on the message bus, you can then use the core functionality of Solace message routing to move the stats that you want about any of your message routers, and deliver them anywhere in your Enterprise.
- Using the Enterprise Stats topic hierarchy allows consumers to easily consume the specific stats that they want without changing any code at all. For example, if you are on an app team and you are only interested in collecting stats about a single VPN, you can run an instance of the receiver configured to only subscribe to stats regarding that VPN. Many instances of the Stats Receiver can be run within your organization, each getting only the data they need, perhaps each saving stats in unique data destinations. This flexibility is very powerful.
- If you need to push stats into a destination that Solace doesn’t have available out of the box, either you or a Solace consultant can easily write your own receiver plug in, and extend the solution to save the stats wherever you need to. I will show you how to do this in a future blog post.
A Statistic
In the receiver framework, stats are made available to the plug in. Let’s take a look at what these statistics look like. Each stat has the following members:
String TopicName
Map<String, String> Tags
Map<String, Object> Values
Long Timestamp
The following subsection examines each of these members.
The Topic Name
The topic name is an abbreviation of the topic that the Pump published the message on. Each unique type of stats has a unique name. Examples include: SYSTEM_CSPF_NEIGHBOR_STATS, SYSTEM_MSG-SPOOL, SYSTEM_MEMORY. See the notes below under Available Stats regarding the complete list. If using a relational database to write these stats, you would likely have a separate table for each unique topic name.
The Tags
The tags are the unique identifiers which together unambiguously identify the entity for which the stat pertains. In relational database terminology, these are the composite primary key values. The list of possible tags varies from message to message. Let’s look at a few examples of live data:
- SYSTEM_CSPF_NEIGHBOR_STATS
tags: {ROUTER_NAME=sgp-core-01, NEIGHBOR=syd-core-01}
In this case, the identifying tags are the name of the router and the name of the neighbor link.
- SYSTEM_MEMORY
tags: {ROUTER_NAME=nov-core-02}
The system memory stat only needs to identify the router.
- SYSTEM_INTERFACE
tags: {ROUTER_NAME=ire-core-01, PHY_INTERFACE=intf0}
The interface stats need to identify the router and the interface.
If you are writing to a database, these tags will most likely be your identifying attributes or primary keys. Time series databases such as InfluxDB allow you to explicitly identify the TAGS for each row of data. In contrast, relational databases require creating a schema with these tag fields used as (potentially composite) primary keys, or at least indexed.
The Values
The values are passed in as a flattened key value pair map. Nice and simple. Here is an example:
SYSTEM_MSG-SPOOL:
     spool-sync-last-failure-reason = N/A
     total-messages-currently-spooled = 0
     transaction-resource-utilization-percentage = 0.00
     spool-sync-status = Synced
     mate-disk-partition-usage = -
     disk-messages-currently-spooled = 0
     disk-array-wwn = N/A
     operational-status = AD-Active
     datapath-up = true
     spool-while-charging = false
     current-disk-usage = 0.0
     synchronization-status = Synced
     message-count-utilization-percentage = 0.00
     spool-sync-last-failure-time = N/A
     max-disk-usage = 1500
     current-persist-usage = 0.0
     delivered-unacked-msgs-utilization-percentage = 0.00
     current-rfad-usage = 0.0
     active-disk-partition-usage = 39.00
     num-delete-in-progress = 0
     spool-without-flash = false
     next-message-id = 1
     spool-files-utilization-percentage = 0.00
     defrag-status = Idle
     rfad-messages-currently-spooled = 0
     transacted-session-count-utilization-percentage = 0.00
     max-message-count = 240M
     config-status = Enabled (Primary)
     using-internal-disk = true
     transacted-session-resource-utilization-percentage = 0.00
Note that some of the Stats contain hierarchical data. The data is simply flatted down with slashes delineating the levels of the hierarchy in the name. Here is an example of flattened data:
SYSTEM_MEMORY:
     physical-memory/memory-info|1/free-in-kb = 1599708
     event-thresholds|0/name = physical-memory
     ipc-buffers/buffer-info|1/free-buffers = 16526
     ipc-buffers/buffer-info|3/free-buffers = 450
     ipc-buffers/buffer-info|4/total-buffers = 10
     ipc-buffers/buffer-info|5/free-buffers = 1
     ipc-buffers/buffer-info|0/free-memory-in-kb = 2048
     subscriptions-memory/memory-info|0/type = Memory
     subscriptions-memory/memory-info|0/free-in-kb = 131053
[snipped for brevity]
The Timestamp
This is a simple long integer value, in milliseconds, from midnight, January 1, 1970 UTC. It is when the stat was obtained from the router. This is critical for any visualization or planning surrounding your data.
Available Stats
All stats which are available in the Solace message router can be consumed in a Stats Receiver. Take a browse around in SolAdmin or the CLI take note of the verbose information regarding the message routers health and usage as well as details about each and every connected client and endpoint. The StatsPump comes out of the box with a fairly comprehensive set of Stats collected as it’s default configuration. From there, you can easily streamline what you want the StatsPump to provide on the bus, adding more in some areas and reducing it in others as you need.
For a complete guide of all of the statistical information available to you, please refer to the Solace Command Line Interface reference documentation.
Summary
In this blog we have:
- Overviewed the consistent components of the solution
- Overviewed the path to getting Enterprise Stats up and running in your enterprise
- Examined the value of architecture
- Discussed what stats look like
- Discussed what stats are available to you via this solution
In an upcoming blog post, I will show you how build your own Stats Receiver plug-in for moving Stats into your favorite data repository.
Please feel free to leave me any comments regarding this blog, or leave comments for the entire community to get involved in.
Explore other posts from category: DevOps


Subscribe to Our Blog
Get the latest trends, solutions, and insights into the event-driven future every week.