Read the post in プレスリリースを読む 보도 자료 읽기
As part of becoming event-driven, you need to event-enable your logging infrastructure to get the most benefit out of doing so. I’ve written blog posts about how Solace helps with logging and how to integrate Logstash with Solace. These posts assume that you aren’t already using something like Elastic Stack for logging. But what if you are? That’s the question I would like to answer with this post by presenting an example where the applications are deployed in a container platform that provides built-in log aggregator and search stack.
The Case with Container Platform
Let’s look at a specific example of an architecture where application logs are streamed into a centralized log system. In this sample, microservices are deployed as containers. These containers can be a Docker environment or Kubernetes environment such as Red Hat OpenShift Container Platform (OCP) or Google Kubernetes Engine (GKE) and many other distributions.
Kubernetes Cluster-level Logging
For Kubernetes platform, some distributions provide a native solution for cluster-level logging, but you can always build such capability on your own. You can use a node-level logging agent that runs on every node or use a sidecar pod for each application. Please refer to Kubernetes logging documentation for more information on Kubernetes cluster-level logging.
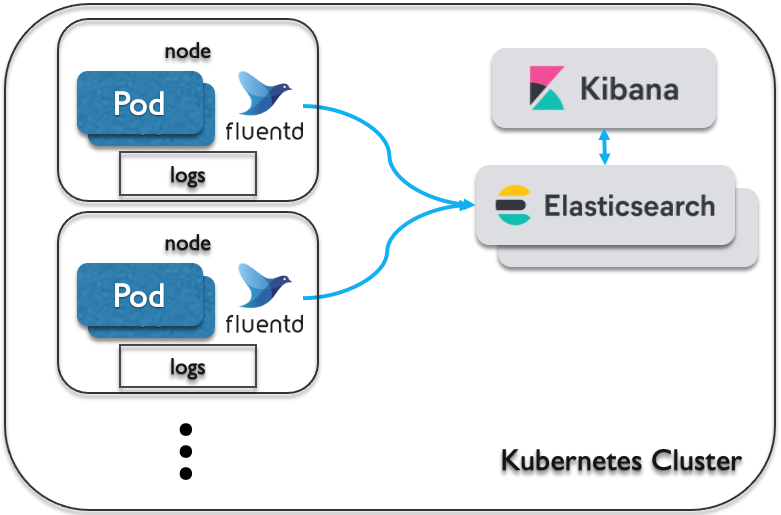
Figure 1: Simplified Illustration of Kubernetes Cluster-level Logging
The illustration above is using fluentd as the logging agent that runs on all worker nodes and forward those logs to an Elastic Stack. So, they are streaming logs and having a centralized logs server, but are they really event-driven?
The Missing Piece
It’s nice for the IT administrators to be able to query against the complete set of logs from their entire Kubernetes cluster from a single web page. It is also nice that application developers don’t need to worry about developing their application to write and send logs in a uniform and centralized manner. But the log data is now accessible only from the log dashboard. It is easy for people to read, but it’s not accessible to any other systems in real time.
The Elastic Stack provides a nice logging tool for technical folks to dig into the logs to find errors or to investigate incidents. It is also very useful to track a specific transaction when there’s a customer complaint. But the customer service officers don’t usually have access to this system, and even if they do, it might not be that useful for them with all the gory details shown in the logs.
What if those logs could be streamed in real-time to the whole enterprise in a way that’s useful to each recipient? What if specific systems such as customer service can subscribe to specific type of events? Any new systems developed in the future can easily subscribe to the stream of logs and have the relevant information in real time, including ad-hoc applications. And even better, it can be done with many languages and open standards protocols.
Event-Enabling Kubernetes Cluster-level Logging
So now you have an Elastic Stack as part of your logging cluster. Our idea of event-enabling the logging is to make these log events accessible by other systems in your enterprise, not just to the Elasticsearch log store. And what better way to achieve that than publishing the log events into Solace PubSub+ Event Broker, right?
Publishing events to Solace PubSub+ Event Broker can be done with the many supported native and open standard messaging APIs and protocols, and also with REST. If we’re looking at something like a webhook, there is a Webhook action feature provided by Elasticsearch. But this is not the best way to go for two reasons:
- The ‘publishing’ will be done by Elasticsearch, but I think it’s better to let fluentd do the publishing, as the log collector who has the events firsthand.
- Elasticsearch Actions are executed only if the specified conditions set on the Watchers are met. My understanding is that the Watcher feature is not available for free.
So, what’s the (better) alternative? I’d say the events should be published from the log collector directly instead of from the log store. So, I was looking at fluentd. I decided to use MQTT to publish events out to Solace PubSub+ and I’ll be using this MQTT plugin for this blog. Do note that some distribution’s native cluster-level logging feature might not support changes to their logging collector component.
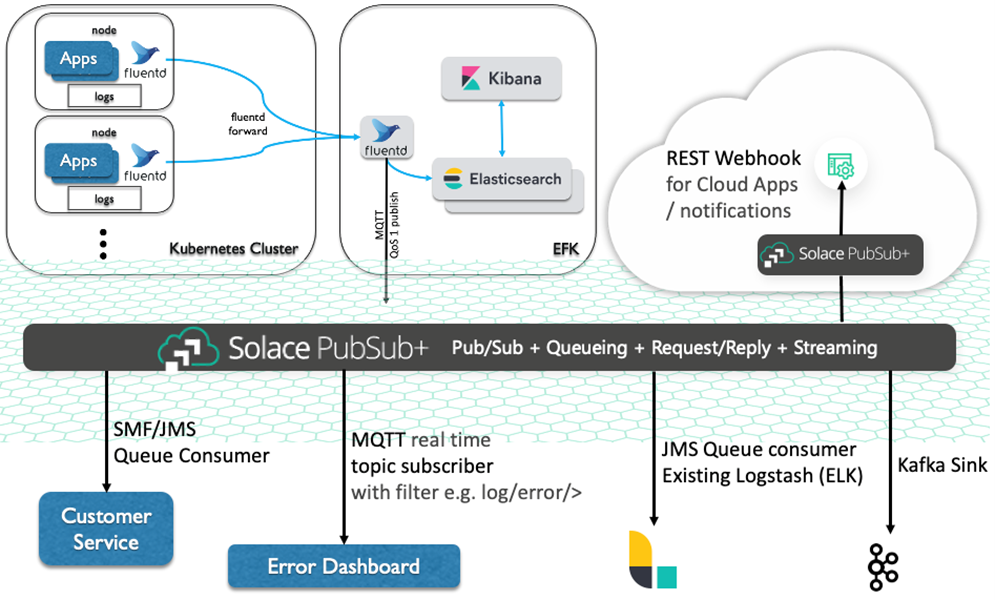
I’d prefer the idea of having your own dedicated Elastic Stack outside of the Kubernetes cluster. This is usually done by customers who bought their own enterprise license of the Elastic Stack, or who need much bigger capacity, or simply have an existing stack. We then only need to publish events to Solace PubSub+ from this single external fluentd. Take a look at the following illustration for such approach.
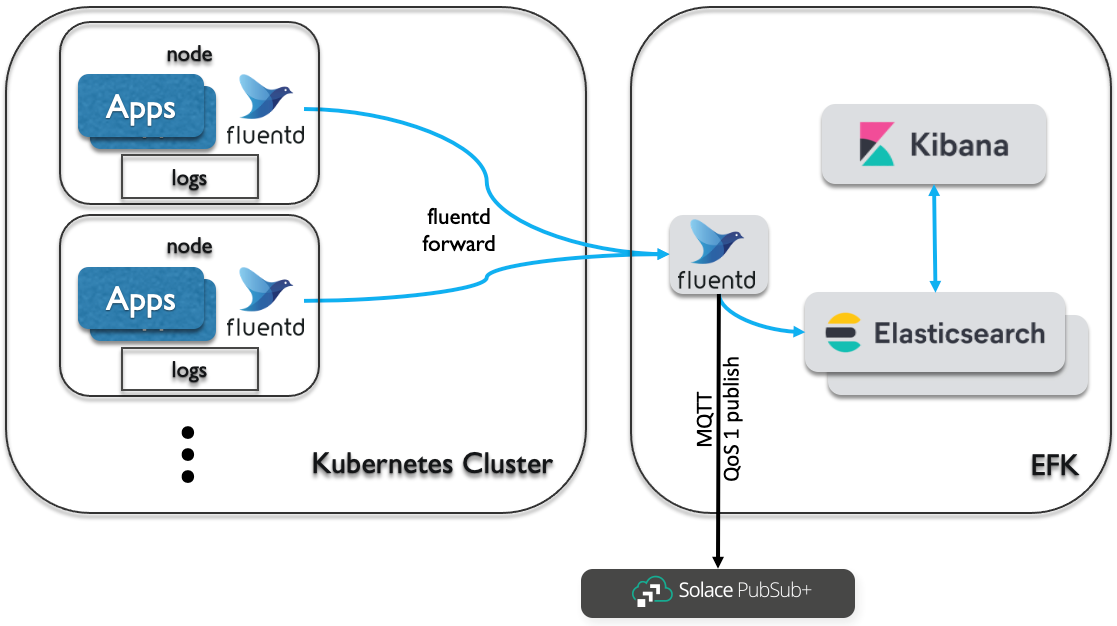
Figure 2: Event-enabling Kubernetes cluster-level logging
Topic Routing at the Heart of Event-Driven Architecture
We can’t talk about event-driven architecture without talking about topic. Topic routing is at the heart of what Solace PubSub+ Event Broker does. It enables an efficient and elegant way of routing events between systems and it also has the key capability we need to build a dynamic network as what we call an event mesh. Please check out our “understanding topics” documentation for more information.
Now, we will publish logs to Solace PubSub+ Event Broker with a specific topic. Note that I say ‘with’ not ‘to’ when I talk about topic in Solace PubSub+. That’s because these topics are metadata, part of the messages we send to the broker. They’re not something we need to create beforehand. This is key to having a very flexible and performant event broker, and I invite you to take a look at my buddy Aaron’s video “All About Solace Topics”:
To be able to publish to specific topic, we have options to set it up in the log collector itself or later in the MQTT output plugin. Or better yet, you can customize both to get your best fit solution. The idea here is to make sure we have a good design on the topic hierarchy to gain most benefit of these events. Take a look at this blog post for Solace’s best practices on topic architecture or these technical documents for a deeper dive.
We talked about Docker container and Kubernetes platform, but I’ll just quickly refer to how we can customize tag in our Docker log driver documented here. So you can specify some static topic hierarchy as well as some special template markup for that particular container. For Kubernetes, you’ll have to look at your distribution’s documentation, but I would assume it will be very similar to Docker.
I have also linked the MQTT output plugin I am using for this blog, and here’s the sample project to run a container using fluentd with MQTT output plugin configured to publish to Solace PubSub+ Event Broker running as another docker container. Pay attention to the topic_rewrite_pattern and topic_rewrite_replacement options to customize if you want to have a different topic to publish to.
The topic hierarchy enables the event subscribers to subscribe to specific, filtered events based on their needs. And it’s done simply with the topic routing, no logic or filtering effort on the subscribers’ end. For example, if you have multiple clusters and multiple applications, a subscriber can subscribe to only a specific cluster or only to specific applications regardless of where the cluster is.
In the sample project, we are using a sample tag of acme/clusterx/appz/<container id>. In this case, a subscriber can subscribe to acme/clusterx/> to get all log events from cluster X, or subscribe to acme/*/appz/> to subscribe to app Z log events from any cluster. You can also subscribe to a specific log level if that is part of your topic hierarchy. All without having to predefine any topic in the broker! And it’s only gets better when we use it with an event mesh!
An event mesh is a configurable and dynamic infrastructure layer for distributing events among decoupled applications, cloud services and devices. It enables event communications to be governed, flexible, reliable and fast. An event mesh is created and enabled through a network of interconnected event brokers. In other words, an event mesh is an architecture layer that allows events from one application to be dynamically routed and received by any other application no matter where these applications are deployed (no cloud, private cloud, public cloud). This layer is composed of a network of event brokers.
That means topic routing dynamically across multiple sites/environment, on-premises or cloud, and with many stack and open standards APIs/protocols!
The Event Mesh
Once we event-enable our Kubernetes cluster logging by publishing events into Solace PubSub+, the log events are now accessible in real time for the whole enterprise as well as the external system’s event across cloud environment.
The first system to benefit is the customer service application, which now can consume the log events in a guaranteed fashion, within its own capacity. The broker will act as a shock-absorber during sudden increase of incoming log events traffic, as well as keeping the events safely stored if the application is down or disconnected for some time.
Since the events are now available on the event mesh, we can expand and have many more systems subscribe to these events. They can use Solace native API (SMF), JMS for the legacy Java enterprise apps, Webhooks, or even Kafka connectors. And they can be subscribing right there on the same datacenter, or somewhere on the cloud.
The idea of having an event mesh is that these systems can dynamically subscribe to events from anywhere, and the mesh will route the events across. No fixed point-to-point stitching, and no wasted bandwidth for synchronizing events across multi cloud environment when there’s no one subscribing.
Conclusion: Kubernetes Cluster-Level Logging and Elastic Stack
I’ve covered the advantages as well as shortcomings of having a centralized logging system such as Kubernetes cluster-level logging and Elastic Stack, and ways to event-enable it to realize greater potential of your enterprise logs. The event mesh capability uniquely provided by Solace PubSub+ extends this even more. Hopefully this idea sparked your interests and curiosity to go and event-enable your own systems and reap the event-driven architecture promises! What are you waiting for? Get on to Solace Developers to start building your own event-driven logging with Solace PubSub+ and Elastic Stack!
Explore other posts from category: For Developers

 Ari Hermawan