- On average, how many consumers does your enterprise, or a particular team, have for each event?
- Are you getting more reuse of your events over time?
- Which events enjoy the limelight of constant reuse, and conversely, which ones languish in the shadows of neglect?
In the grand tapestry of EDA, every event is a thread that contributes to the overall picture. Understanding each event’s usage patterns is paramount, as is how that reuse evolves over time. But let’s be real, you can’t show improvement in something you can’t measure.
So, how do you measure the reuse of your events and track your progress over time? Well, lucky for you, we’ve integrated a KPI dashboard into Solace Event Portal that does just that. It’s your go-to resource for measuring and enhancing event reuse.
Let’s explore event reuse index and how to use it.
Understanding Event Reuse Index
The event reuse index you can see and track with Solace Event Portal’s new KPI dashboard is a game-changer for organizations that want to optimize their systems by measuring event reuse and encouraging teams to build reusable components. It provides a clear and comprehensive view of how events are being reused across your entire organization and by individual teams.
Whether you’re creating events as part of a design-first strategy or importing them from runtime environments, the KPI Dashboard gives you the visibility you need to monitor and quantifiably measure improvements in the reuse of your digital event assets.
Your event reuse index is the total number of consuming applications divided by the total number of events.
Deciphering the Reuse Index: What’s in the Numbers?
So, what is event reuse index really telling you? Let’s break it down:
Higher Is Usually Better, But Not Always
A higher reuse index is usually good news – it means your events are in demand, being consumed by many. But hold on! Extremes aren’t cool. If your event reuse index skyrockets because you have just one event for your entire enterprise, that’s a red flag. So, it’s good to shoot for a high event reuse index, but not at the expense of good design.
Don’t Sweat the Initial Index
Starting with a low reuse index isn’t the end of the world. In fact, it’s common when you’re new to this event management game and don’t have tools to encourage reuse or measure it. What matters is the journey – that number should climb over time. A growing reuse index reflects increasing efficiency, and that’s what you want to strive for.
Shared Events are the Real Deal
Pay attention to the reuse index on shared events – those events that are shared between application domains. They’re the VIPs of your architecture – produced for other teams. How well are they performing? That’s the real litmus test.
Team Face-Off
Ready for some healthy competition? Compare reuse index across different application teams. If one team is crushing it with a much higher index, dig in. What’s their secret sauce? There might be a lesson or two to learn that can help other teams increase their own.
Popular Events vs. Lonely Ones
Take a good look at the events with lots of consumers. Why are they the life of the party? What makes them so darn useful? On the flip side, those events generating the sound of crickets – why the solitude? Do you really need them hanging around?
Key Features of the KPI Dashboard
Comprehensive View of Event Reuse Indexes
The new KPI Dashboard lets you view reuse indexes for all your shared and non-shared Solace and Kafka events in Designer across your entire organization and at an application domain level. This is instrumental in understanding the event data reuse with your current event-driven approach, allowing you to make informed decisions and take strategic actions. 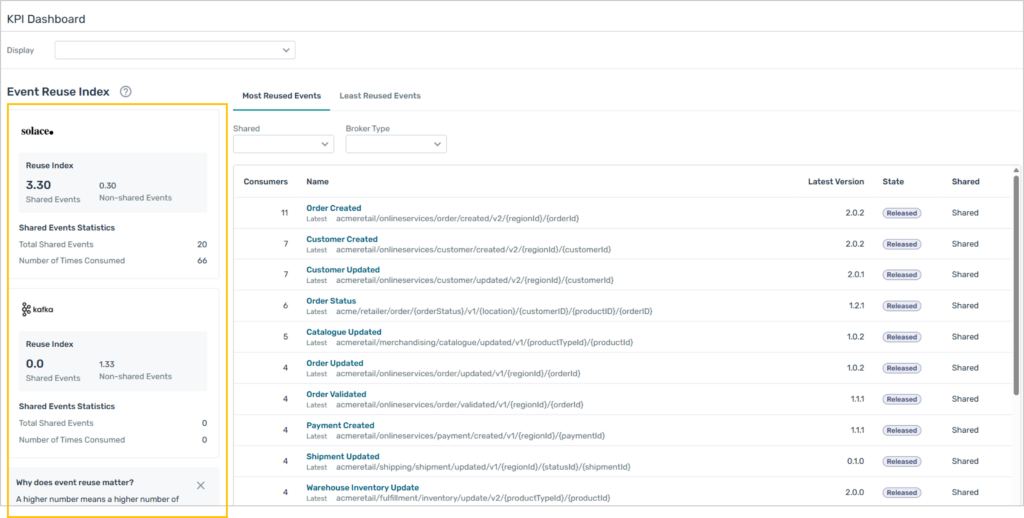
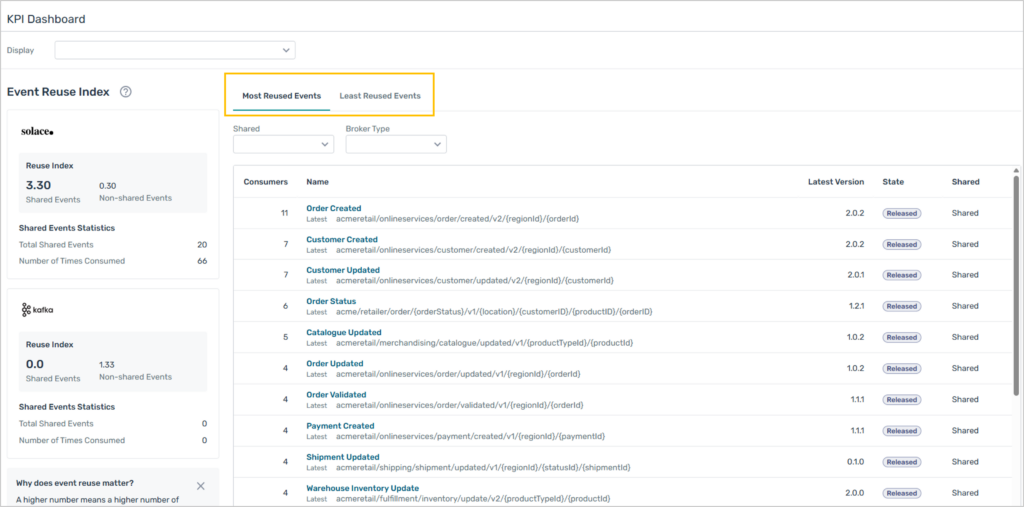
Identify Top Performers and Underutilized Events
The dashboard provides a snapshot of your 20 most and least reused events so you can recognize top performers and identify areas for improvement, or in which you can get rid of events that aren’t being consumed at all. It allows you to focus your efforts on understanding why some events are so popular while others aren’t, and how the successful characteristics can be replicated elsewhere.
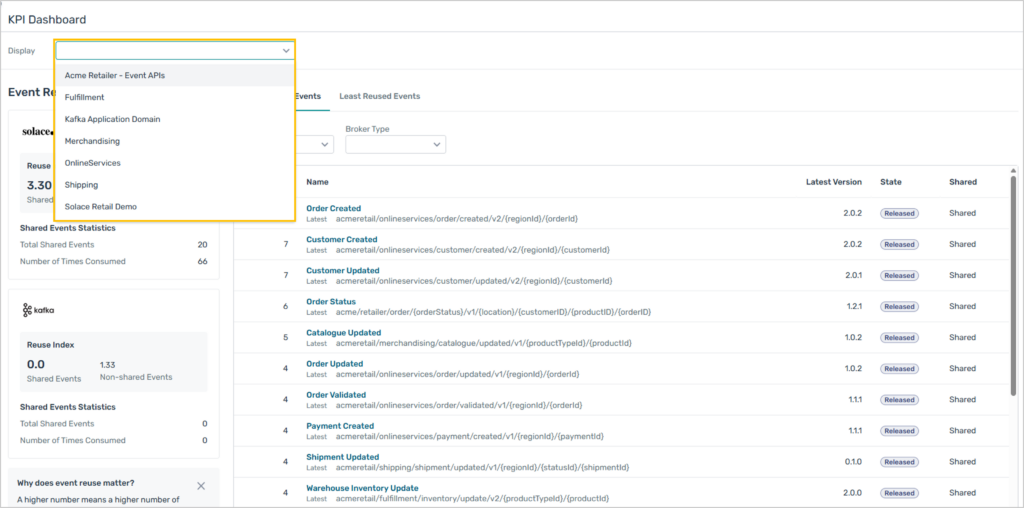
Application Domain Filtering
By filtering your dashboard by application domain, you can compare event reuse across development teams or segments of your organization. That means you can see how application teams are doing and identify ways teams that are struggling can improve the reuse of their own event assets.
Conclusion
The event reuse index is an excellent measure of how efficient, and effective your system is. It is a measure of maturity as you apply event driven techniques and a view as to the hopefully increasing efficiency of your teams.
At a personal level, I find this feature particularly exciting because it’s a testament to the ability of Event Portal to empower users with knowledge and insights that help them continuously improve their development practices.
Try Solace Event Portal for free and find out what your own event reuse index looks like!
Explore other posts from categories: Event Portal | For Architects | For Developers | Products & Technology


Subscribe to Our Blog
Get the latest trends, solutions, and insights into the event-driven future every week.