This article aims to help you understand the throughput of Solace Event Broker in a variety of form factors and scenarios, both point-to-point and fan-out, that should approximate some of your own use cases.
Summary of Results
Detailed descriptions of test methodology, parameters and results are provided below, but here is a summary of the results:
Table 1 – Summary of Results
| Solace Event Broker Software (ESXi)* | Solace Event Broker Software (AWS r6in.4xlarge)* | Solace Event Broker Appliance (3560) |
|
|---|---|---|---|
| Messages Per Second | |||
| Non-persistent (Direct) point-to-point** | Messages Per Second: 2,500,000 | Messages Per Second: 1,700,000 | Messages Per Second: 11,000,000 |
| Non-persistent (Direct) fan-out** | Messages Per Second: 8,800,000 | Messages Per Second: 7,900,000 | Messages Per Second: 24,000,000 |
| Persistent message point-to-point*** | Messages Per Second: 170,000 | Messages Per Second: 94,000 | Messages Per Second: 640,000 |
| Persistent message fan-out*** | Messages Per Second: 820,000 | Messages Per Second: 670,000 | Messages Per Second: 2,800,000 |
| * 100k service ** 100B message size for direct messaging (fan-out, 10) *** 1KB message size for persistent messaging (Fan-out, 10) |
|||
These results show that Solace Event Broker: Software offers very fast, scalable performance. In general, it behaves a lot like the 3560 appliances, just at lower message rates. That isn’t surprising since Solace Event Broker Software is based on the same underlying code that runs our appliances. And while the Solace Event Broker performance numbers in AWS are lower than in ESXi, this is not so much a limitation of the software, but the network and storage bandwidth limits of the AWS EC2 instance, and the IOPS limits of the EBS volume.
Testing was performed on a Solace Cloud managed service in AWS which at the 100K service level uses an r6in.4xlarge EC2 instance. An EC2 instance with high network bandwidth capacity (such as the r6in) yields high performance numbers in high fan-out use cases, and in point-to-point non-persistent messaging use cases with larger message sizes. A 100K Event Broker service running in AWS uses a gp2 EBS storage volume with 1,000GB capacity which offers good performance at a reasonable cost for the persistent message store.
Testing is all done with TLS enabled, since this represents real-world scenarios for most customer use cases. TLS is essential for security and notoriously CPU intensive; the need to process every byte of the stream in user-space for decrypting and encrypting can reduce the efficiency of some event brokers, making performance with TLS an important benchmark. At scale, this has a real impact in real world use cases whether streaming queues or writing to log files in the case of other architectures.
Solace Event Broker: Appliance offers the highest possible throughput and performance, so if you want to support massive messaging capacity or scale across many applications in a compact footprint, this purpose-built hardware is for you. For many use cases, organizations benefit from deploying in private or public clouds using software and/or managed services. The beauty is you can mix and match, or switch from one to another, without application or management impact.
The following is a brief introduction to the performance scenarios to help you understand the results.
The first set of scenarios cover non-persistent messaging using the Solace Direct message delivery mode. The results cover point-to-point and fan-out message traffic.
The second set of scenarios cover persistent messaging. Here again the results cover point-to-point and fan-out message traffic.
Methodology
These performance results look at message throughput for point-to-point and fan-out scenarios. The results measure Solace Event Broker in terms of messages per second. These message exchange patterns are explained in more detail in our core concepts page but this section briefly describes these two patterns as they apply to the performance scenarios.
Point-to-Point
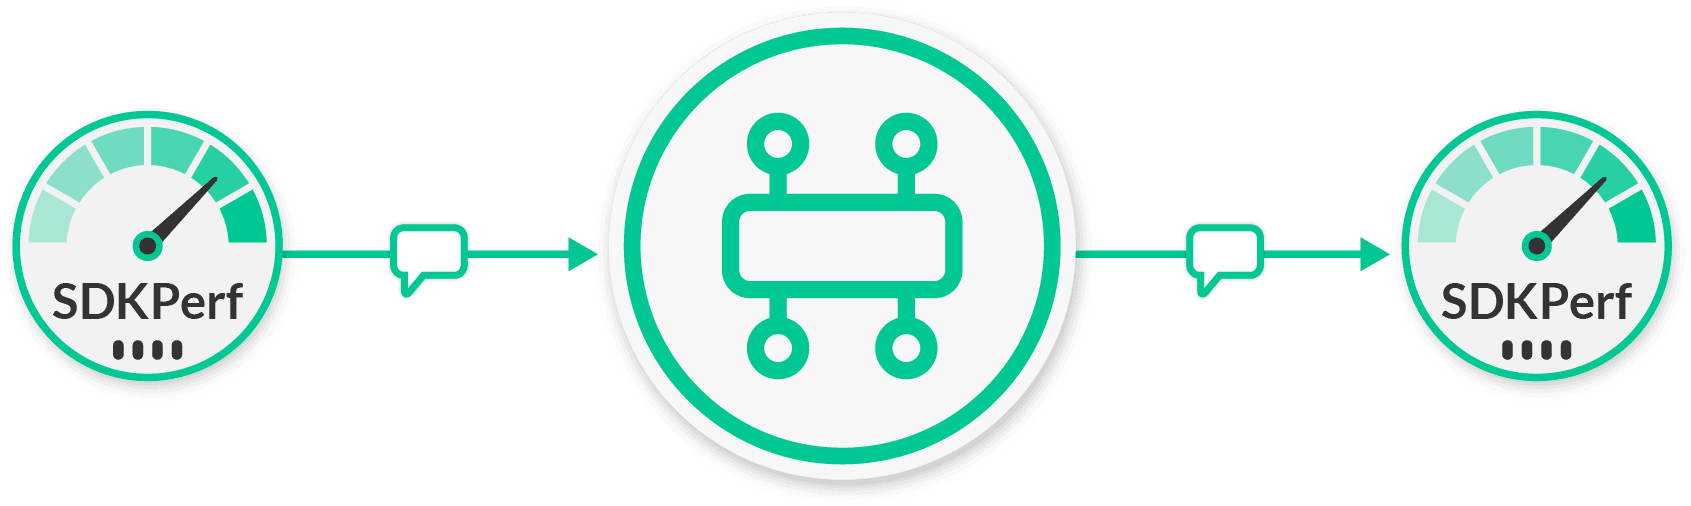
A point-to-point flow is a single publishing client sending messages to the Solace Event Broker which are received by a single subscribing client.
Fan-Out
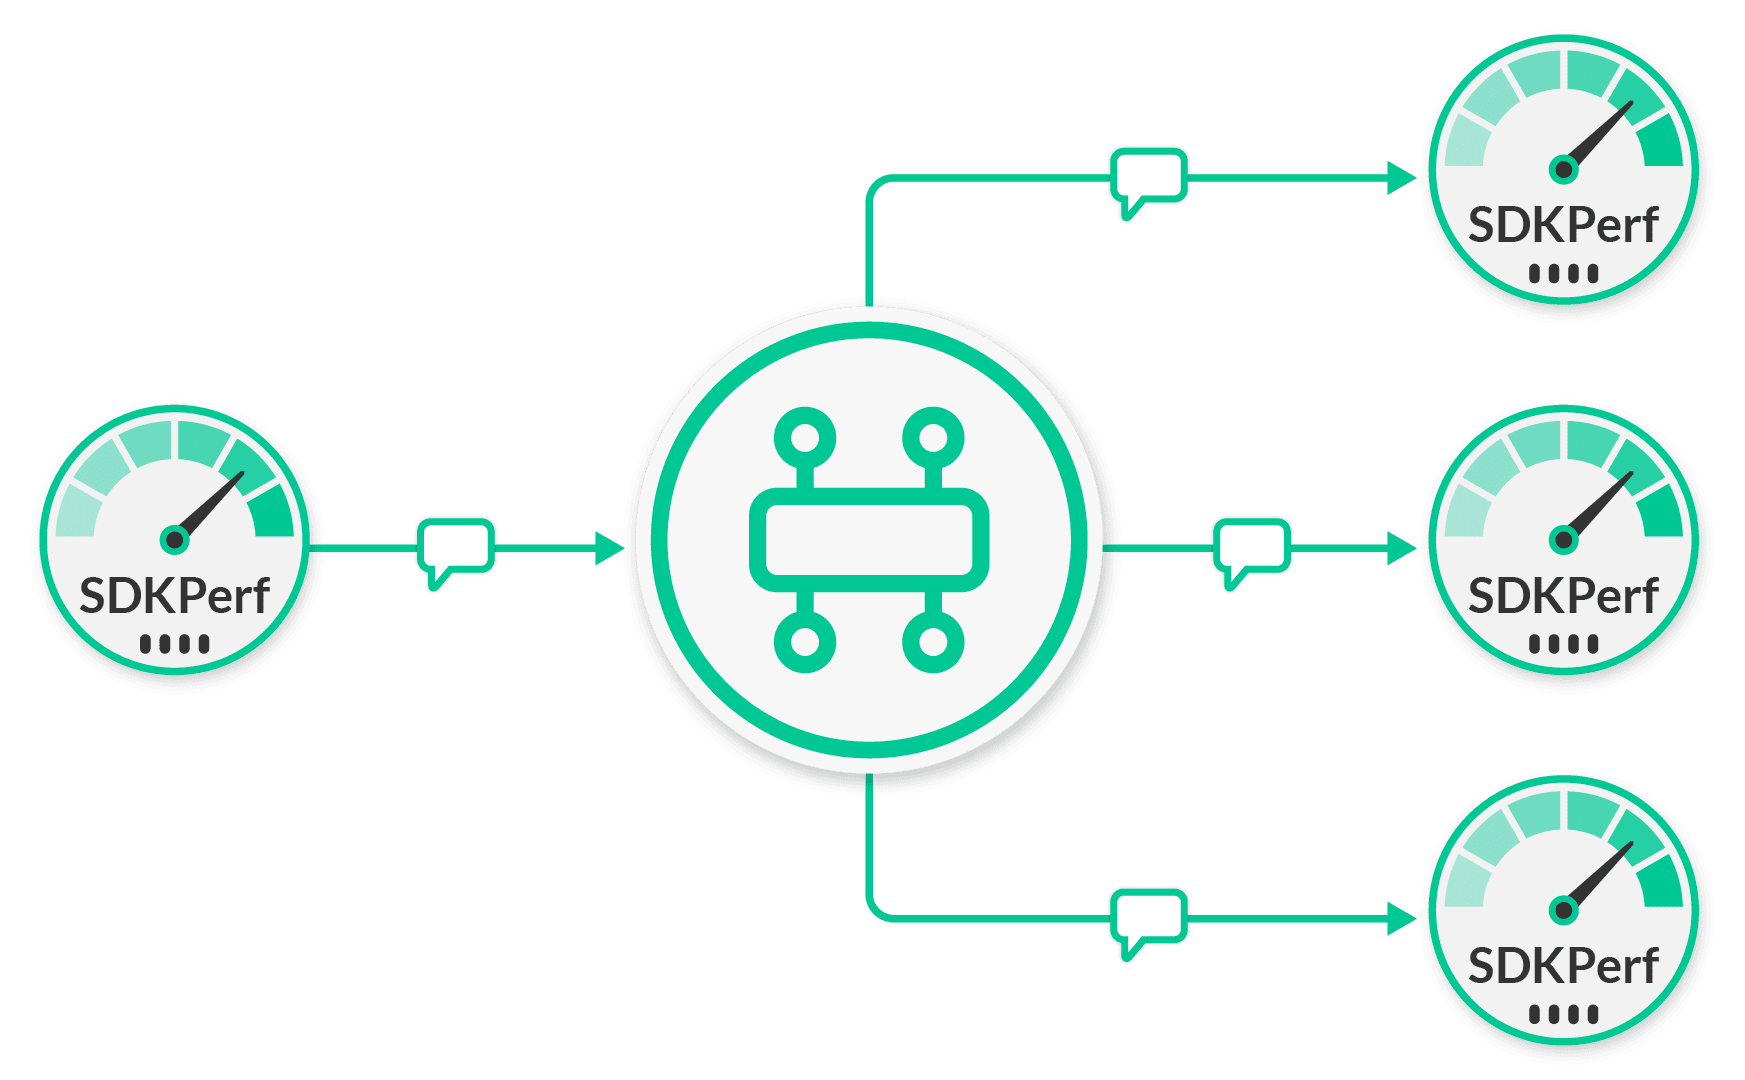
Fan-out is the typical publish/subscribe scenario where a message is published once to the Solace Event Broker and forwarded to multiple clients who have expressed interest in receiving messages of that kind through topic subscriptions. So the message is then fanned out to the clients by the Solace Event Broker, and each client receives a copy of the message.
SDKPerf Test Tool
![]() For all scenarios, the Solace test tool SDKPerf was used as the traffic source and sink. Because we take performance very seriously, over many years we have built SDKPerf into a very capable tool that can be used to test many different messaging APIs. You can find out more about the tool on our SDKPerf overview and you can download the tool and try it yourself as well. For these tests, sdkperf_c was used.
For all scenarios, the Solace test tool SDKPerf was used as the traffic source and sink. Because we take performance very seriously, over many years we have built SDKPerf into a very capable tool that can be used to test many different messaging APIs. You can find out more about the tool on our SDKPerf overview and you can download the tool and try it yourself as well. For these tests, sdkperf_c was used.
For each scenario, SDKPerf measures the following:
- The received message rate
- Message loss using message ordering information that publisher instances of SDKPerf embed in the messages they send
- Message payload integrity by confirming the received message payloads are unmodified by the messaging system
This ensures that the messaging system is running fast and correctly delivering all messages to the correct consumers without corruption.
Message Delivery Modes
The scenarios in this article cover two types of messaging delivery modes:
- Non-Persistent – Which is “at most once” messaging. Solace Event Brokers provide two options for “at most once” messaging. Both direct messaging and non-persistent messaging achieve this level of service. The results in this article use direct messaging which is the higher performance option.
- Persistent – Which is “at least once” messaging. To achieve full persistence, the messaging system must issue an acknowledgement to the message producer once both Solace Event Brokers have fully persisted the message to non-volatile storage. And messages for consumers must not be removed from the message broker until an acknowledgement is received. Fully persisted means the message is flushed to disk. Often this option is called failsafe messaging in other message brokers. Simply caching the message in the filesystem is not equivalent and can lead to message loss in failure scenarios. Therefore, in this article when results are listed for Persistent messages this is for fully failsafe messaging with no risk of message loss.
Performance Scenarios
In the performance scenarios below, the goal is to measure the maximum performance of Solace Event Broker in each scenario. To achieve this, we use groups of point-to-point or fan-out clients all running in parallel. Each group of clients is monitored to make sure it is running at a rate which it can handle to avoid an individual client becoming the bottleneck and skewing the performance results artificially.
Point to Point
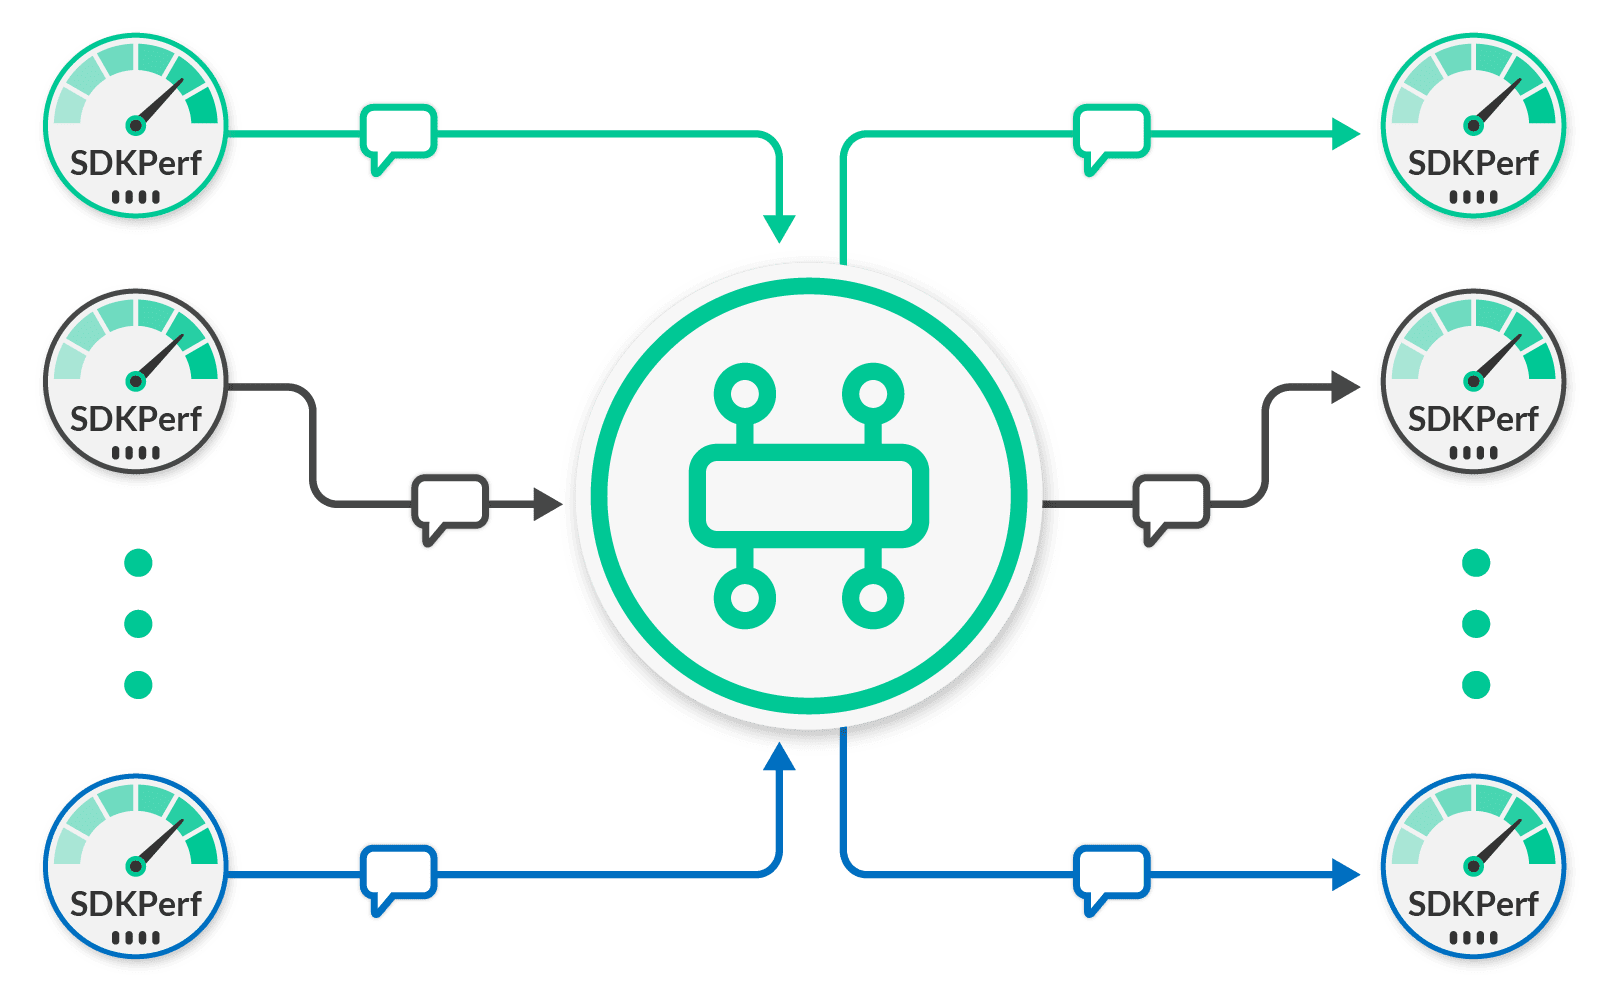
For point-to-point flows, this means you end up with the scenario seen here.
In this figure, client groups are depicted using colors. The figure shows a green, grey and blue group. Each group has a single publishing client sending to a single receiving client. The test uses enough groups of clients such that the broker becomes the bottleneck, not the clients. When you monitor the Solace Event Broker and observe the aggregate messages per second across all clients, you determine the maximum message rate a broker can sustain for the point-to-point scenario.
Fanout
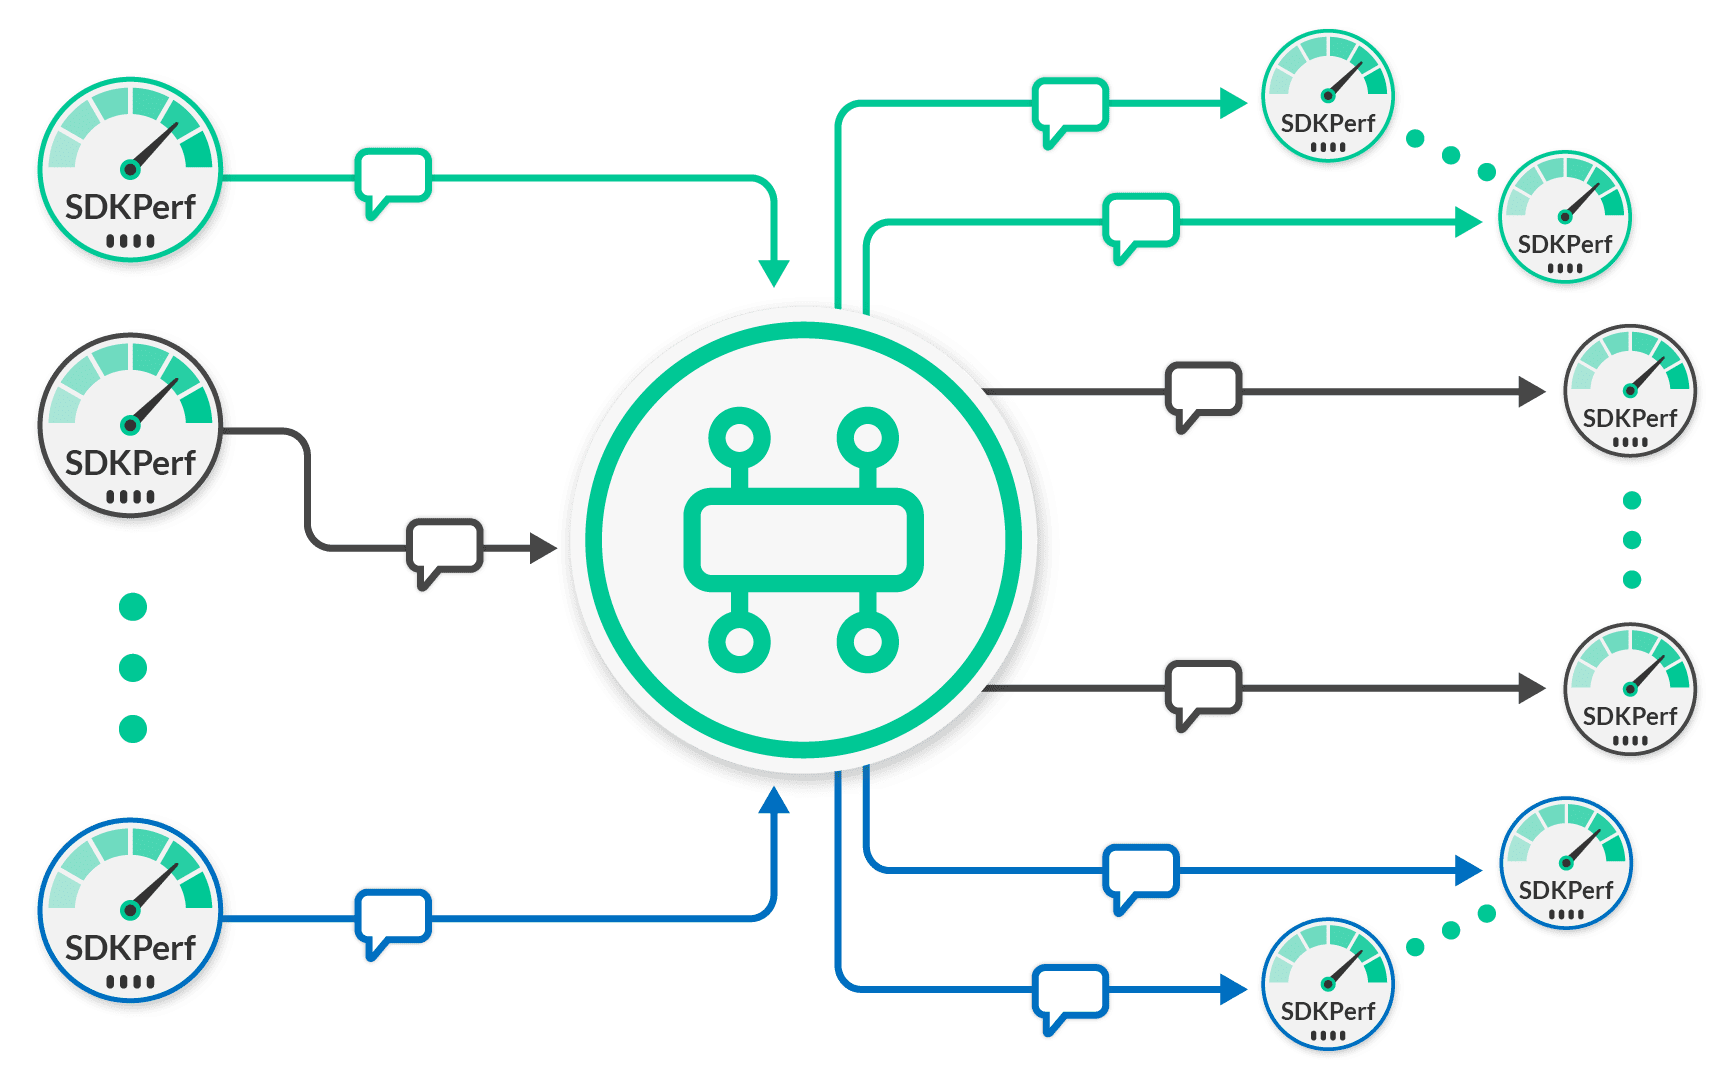
Similarly for fan-out scenarios, you will end up with the scenario illustrated in this diagram.
Again, in this figure, client groups are depicted using colors. The figure shows a green, grey and blue group. And again, the number of client groups is scaled as required until the Solace message broker maximum fan-out rate is observed. The maximum fan-out rate is the total output message rate for the Solace message brokers. Within each group, the number of subscribing clients is dictated by the fan-out factor being measured. So, a fan-out factor of 10 will require 10 subscribing clients per group. To figure out how many messages per second are being sent by clients to the Solace message router, simply take the output message rate and divide by the fan-out factor. This is the input rate.
At Solace we believe in full transparency for all aspects of performance results, so comprehensive details on the exact hardware, setup, and methodology are described below in the section Appendix A: Test Setup.
Point-to-Point Non-Persistent (Direct) Messaging
The following table shows the aggregate output message rate (messages/sec) for Solace direct messages (non-persistent) as the message payload size is varied. In this test, groups of clients are sending messages in a point-to-point fashion. Twenty parallel sets of clients are used to generate the required traffic. Most users prefer to use TLS even over private networks and certainly in public cloud environments and the ratio of CPU cores to network bandwidth is such that it does not affect the message rate in most cases.
Table 2 – Point-to-Point Non-Persistent Message Throughput (Output Msgs/Sec)
| Message Size | Message Size 100B | Message Size 1KB | Message Size 2KB | Message Size 10KB | Message Size 20KB |
|---|---|---|---|---|---|
| Solace Event Broker Software (self-managed) | 2.5M | 410K | 260K | 91K | 56K |
| Solace Event Broker Cloud (AWS) | 1.7M | 500K | 290K | 95K | 52K |
| Solace Event Broker Appliance (3560)* | 11.3M | 2.7M | 1.5M | 360K | 180K |
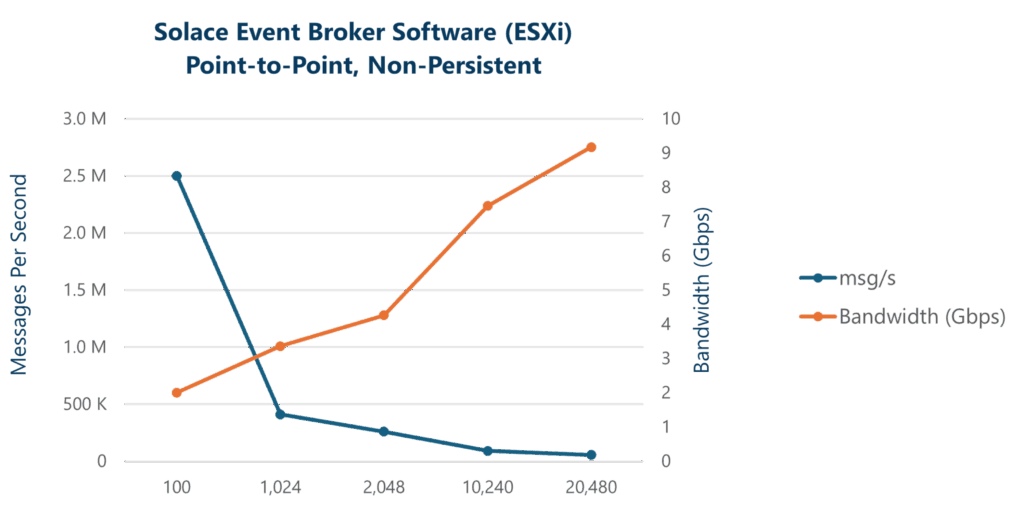
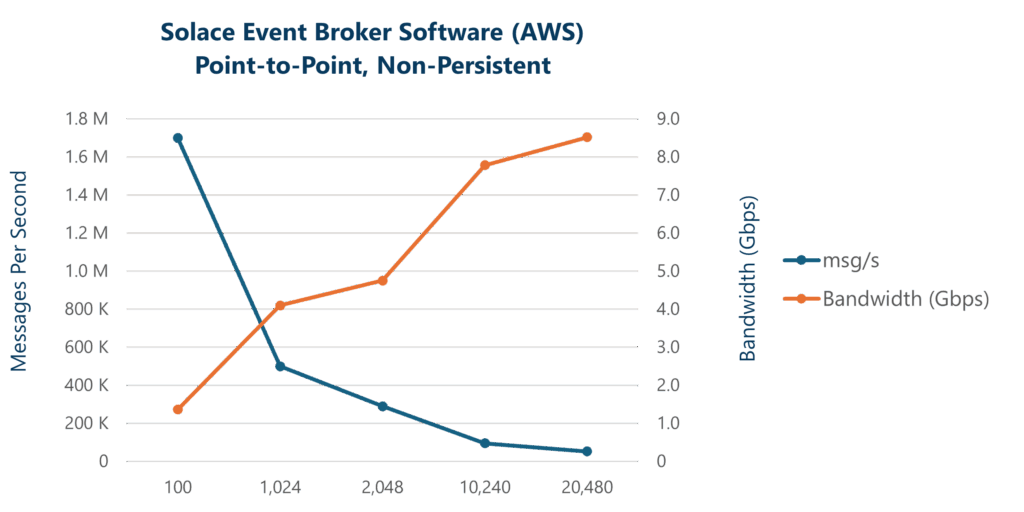
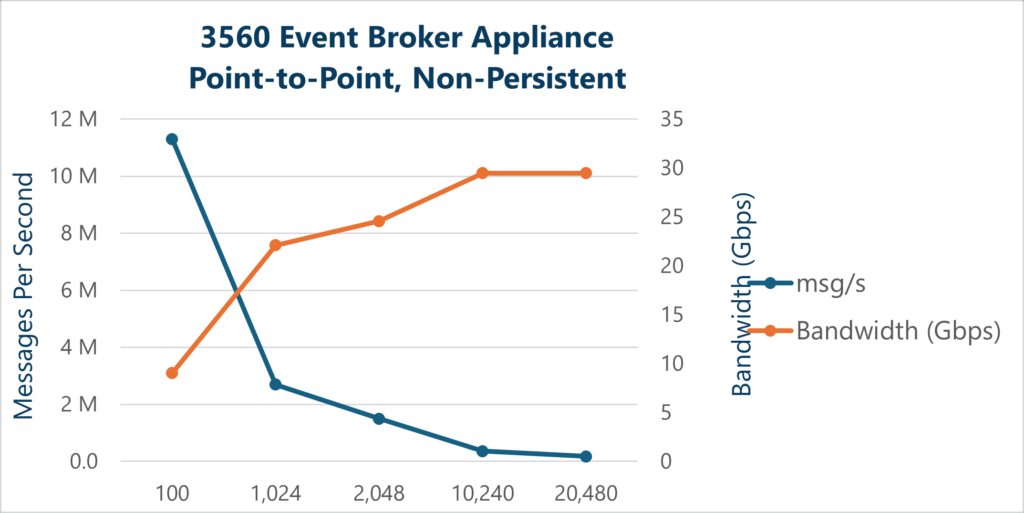
Broadly speaking, two resource limitations are associated with non-persistent messaging: CPU and network bandwidth. CPU cycles are generally consumed per message. Bandwidth limits come into play as the message size increases; larger messages consume more bandwidth. From these results you can see that as expected the highest message rate is for small message sizes.
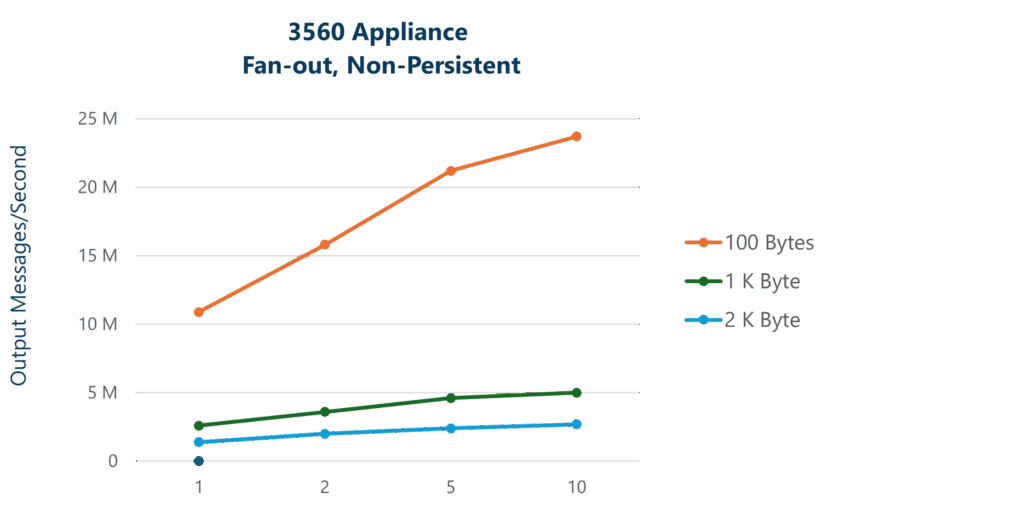
Fan-out Non-Persistent (Direct) Messaging
The following table shows aggregate output message rate (messages/sec) for Solace Direct messages (non-persistent) as the message fan-out is varied. At a fan-out of 1, this scenario is equivalent to the point-to-point scenario above. Then more clients are added to consume the published messages. This increases the fan-out for each message. The broker’s maximum output is recorded for each fan-out of each message size as shown below. Again, twenty parallel groups of fan-out clients are used to avoid any individual client becoming the bottleneck in the test. Note that these measurements were taken with TLS encryption.
Table 3 – Fan-out Non-Persistent Message Throughput (Output Msgs/Sec)
| Endpoints/Subscribers 1 | Endpoints/Subscribers 2 | Endpoints/Subscribers 5 | Endpoints/Subscribers 10 | ||
|---|---|---|---|---|---|
| Msg Size (Bytes) | Endpoints/Subscribers | ||||
| Solace Event Broker Software (ESXi) | Msg Size (Bytes) 100 | 2.5M | 4.0M | 7.4M | 8.8M |
| Solace Event Broker Software (ESXi) | Msg Size (Bytes) 1K | 410K | 660K | 1.0M* | 1.0M* |
| Solace Event Broker Software (ESXi) | Msg Size (Bytes) 2K | 260K | 390K | 640K* | 640K* |
| Solace Event Broker Cloud (AWS) | Msg Size (Bytes) 100 | 1.7M | 3.1M | 5.8M | 7.9M |
| Msg Size (Bytes) 1K | 500K | 800K | 1.3M | 1.7M* | |
| Msg Size (Bytes) 2K | 290K | 460K | 770K* | 910K* | |
| Solace Event Broker Appliance (3560) | Msg Size (Bytes) 100 | 11.1M | 15.8M | 21.2M | 23.7M |
| Solace Event Broker Appliance | Msg Size (Bytes) 1K | 2.7M | 3.6M | 4.6M | 5.0M |
| Solace Event Broker Appliance | Msg Size (Bytes) 2K | 1.5M | 2.0M | 2.4M | 2.7M |
* The results measured reached the bandwidth limit of the NAB on the 3560 Appliance, or the (v)NIC on the software broker.
Graphing these results lets you analyze the overall impact of message delivery fan-out across message payload sizes. At small message sizes, the overhead of processing the small messages dominates. However, as message sizes and fan-out increase, the limiting factor shifts to handling the bandwidth of the messages, particularly on egress. This is seen on the graph when the curves flatten.
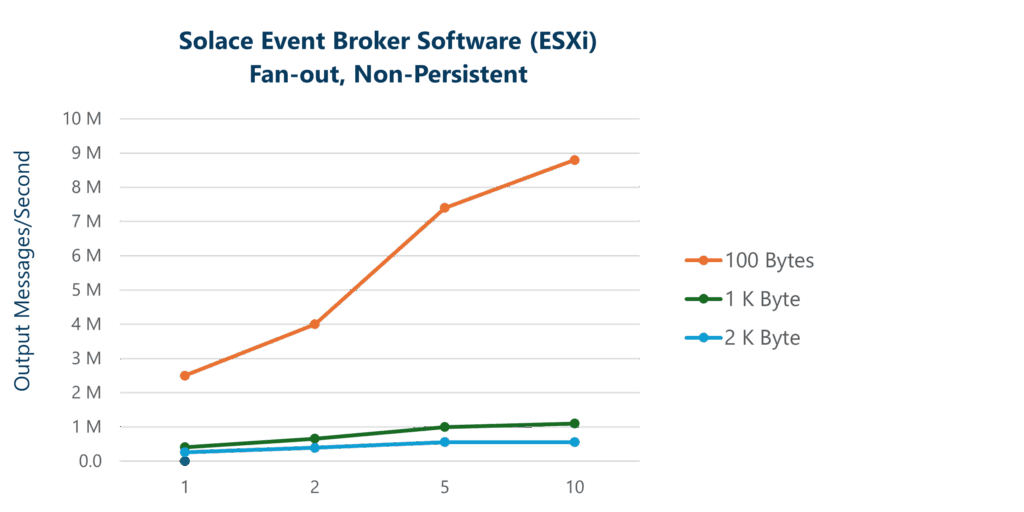
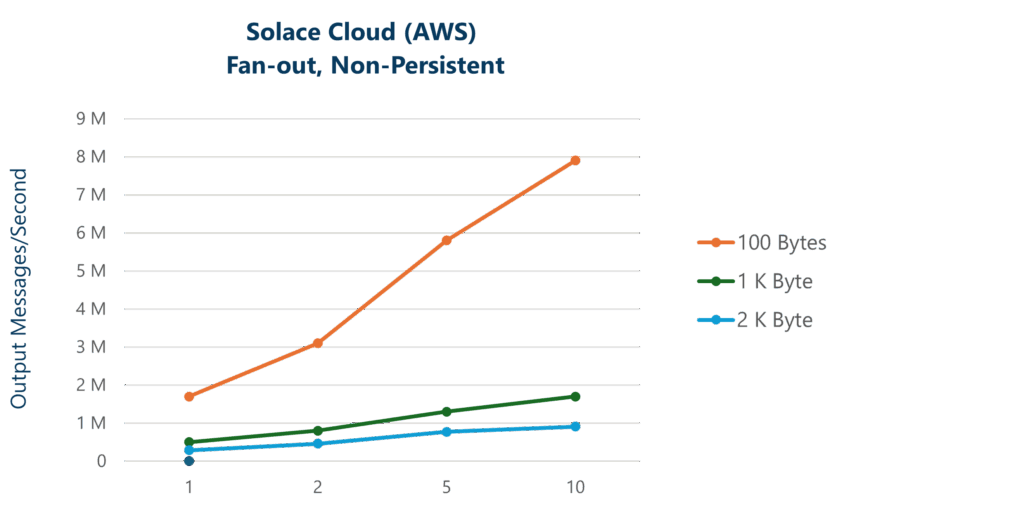
Also interesting is to consider the egress network bandwidth in the above scenarios as that is often the limiting factor in fan-out scenarios since the fan-out factor has a multiplicative effect on network bandwidth. For example, the ESXi server has a 10Gbps NIC and the bandwidth limit is reached at 1K byte message payload size with a fan-out of 5. In AWS, the 100K broker service is deployed on a network optimized instance type and the network bandwidth limit of the r6in.4xlarge EC2 instance is 12.5Gbps and this limit is approached at 2KB message size with 5 fan-out (for fan-out of 10 with 2KB message size, the broker uses burst capacity to go beyond the baseline network bandwidth limit of the instance).
For Solace Event Broker: Appliance, the hardware I/O card, called the Network Acceleration Blade (NAB), has a bandwidth capacity of around 80 Gbps. So as the message size increases, the NAB is able to saturate the network bandwidth and reaches the maximum bandwidth at around the 1K byte message payload size with a fan-out of 10 (without TLS enabled). The tests results shown above we measured with TLS enabled so, the limiting factor is the ability of the NAB to encrypt and decrypt the messages and so, do not show the output bandwidth reaching the full 80Gbps
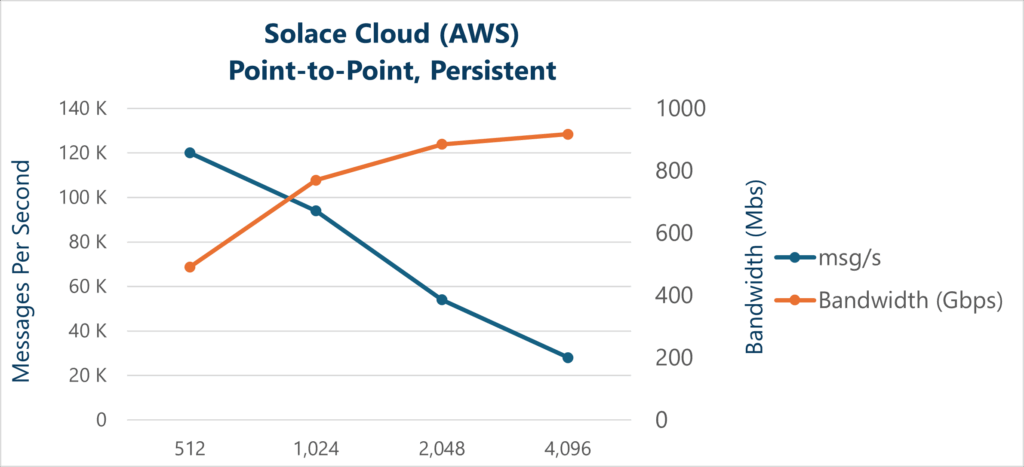
Point-to-Point Persistent Messaging
The following table shows aggregate output message rate (messages/sec) for fully persistent messages as the message payload size is varied. Solace Event Broker is deployed in high availability (HA) groups. When running in HA mode, the publisher does not receive an ACK for a message until it is synchronously stored by two brokers. In this test, groups of clients are sending messages in a point-to-point fashion. Parallel sets of clients are used to generate the required traffic.
Table 4 – Point-to-Point Persistent Message Throughput (Output Msgs/Sec)
| Message Size | Message Size 512B | Message Size 1KB | Message Size 2KB | Message Size 4KB | Message Size 100KB |
|---|---|---|---|---|---|
| Solace Event Broker Software (ESXi) | 200K | 170K | 130K | 92K | 3K |
| Solace Event Broker Cloud (AWS) | 120K | 94K | 54K | 28K | 1K |
| Solace Event Broker Appliance (3560) | 640K | 640K | 510K | 280K | 12K |
As with the non-persistent scenario, from these results you can see that the performance is highest for small message sizes as these are easier to process efficiently. Each of these messages must be saved to non-volatile storage prior to acknowledging the publisher so the overhead is much higher compared to non-persistent messages. Software performance for persistent messaging becomes a function not only of the compute power and network bandwidth, but also the storage IOPS, bandwidth, and latency of the platform on which the software broker is running.
It is also interesting to graph these results and add in calculated bandwidth in Gbps. From this you can see that bandwidth utilization is always increasing as the message size increases (network bandwidth saturation is not hit as it is with non-persistent messaging).


For Solace Event Broker: Appliance, the results for the bandwidth are a little different. The hardware-guaranteed messaging card, called the Assured Delivery Blade (ADB), has an ingress messaging capacity of around 9.5 Gbps, so as the message size increases, the ADB becomes the bottleneck, and the system reaches the maximum bandwidth at approximately the 4K Byte message payload size. From there the output message rate is governed more by the bandwidth capabilities of the ADB card than other factors.
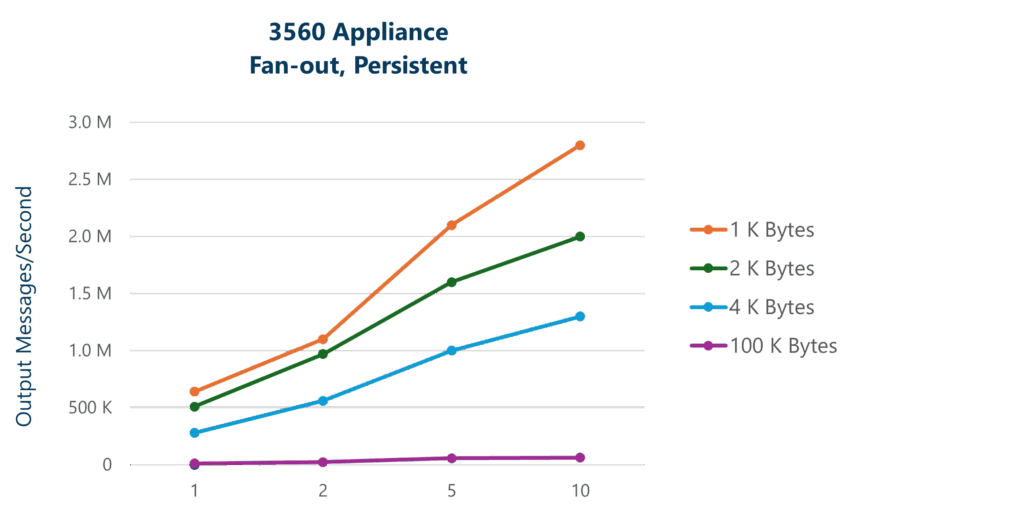
Fan-out Persistent Messaging
The following table shows aggregate output message rate (messages/sec) for fully persistent messages as the message fan-out is varied. At a fan-out of 1, this test is equivalent to the point-to-point test above. Then more clients are added to consume the published messages. This increases the fan-out for each message. Maximum output is recorded for each fan-out and message size as shown below. Again, twenty parallel groups of fan-out clients are used to avoid any individual client becoming the bottleneck in the test.
Table 5 – Fan-out Persistent Message Throughput (Output Msgs/Sec)
| Msg Size (Bytes) | Endpoints/Subscribers 1 | Endpoints/Subscribers 2 | Endpoints/Subscribers 5 | Endpoints/Subscribers 10 | |
|---|---|---|---|---|---|
| Endpoints/Subscribers | |||||
| Solace Event Broker Software (self-managed) (ESXi) | 1K | 170K | 300K | 580K | 820K |
| Solace Event Broker Software (self-managed) | 2K | 130K | 220K | 410K | 450K |
| Solace Event Broker Software (self-managed) | 4K | 90K | 150K | 220K | 240K |
| Solace Event Broker Software (self-managed) | 100K | 3K | 7K | 9K | 10K |
| Solace Event Broker Cloud (AWS) | 1K | 94K | 180K | 390K | 670K |
| Solace Event Broker Cloud (AWS) | 2K | 54K | 100K | 230K | 420K |
| Solace Event Broker Cloud (AWS) | 4K | 28K | 55K | 130K | 260K |
| Solace Event Broker Cloud (AWS) | 100K | 1K | 2K | 6K | 12K |
| Solace Appliance | 1K | 640K | 1.1M | 2.1M | 2.8M |
| PubSub+ Appliance | 2K | 510K | 970K | 1.6M | 2.0M |
| PubSub+ Appliance | 4K | 280K | 560K | 1.0M | 1.3M |
| PubSub+ Appliance | 100K | 12K | 24K | 57K | 62K |
Graphing these results lets you analyze the overall impact of message delivery fan-out across message payload sizes. In this scenario, the work of fanning out the messages is handled by the Network Acceleration Blade (NAB) in the 3560 appliance or the I/O software in the software version.
This offloads the processing from the guaranteed messaging components and enables the message rate to continue to increase as fan-out increases. In the case of the appliance, output increases to over 50 Gbps bandwidth; still all fully persistent.

Appendix A: Test Setup
Performance metrics are only useful if you understand how they were measured and what test equipment was used. The following two figures outline the lab setup when running the tests. Instances of the SDKPerf tool were run on test host servers which were running Linux. Depending on the test requirements, different numbers of servers were used such that the clients never became the bottleneck. For the appliance scenarios, we set up a pair of 3560 appliances in the typical fault tolerant configuration with attached external storage. Up to 16 test hosts were required to generate the appropriate test load.
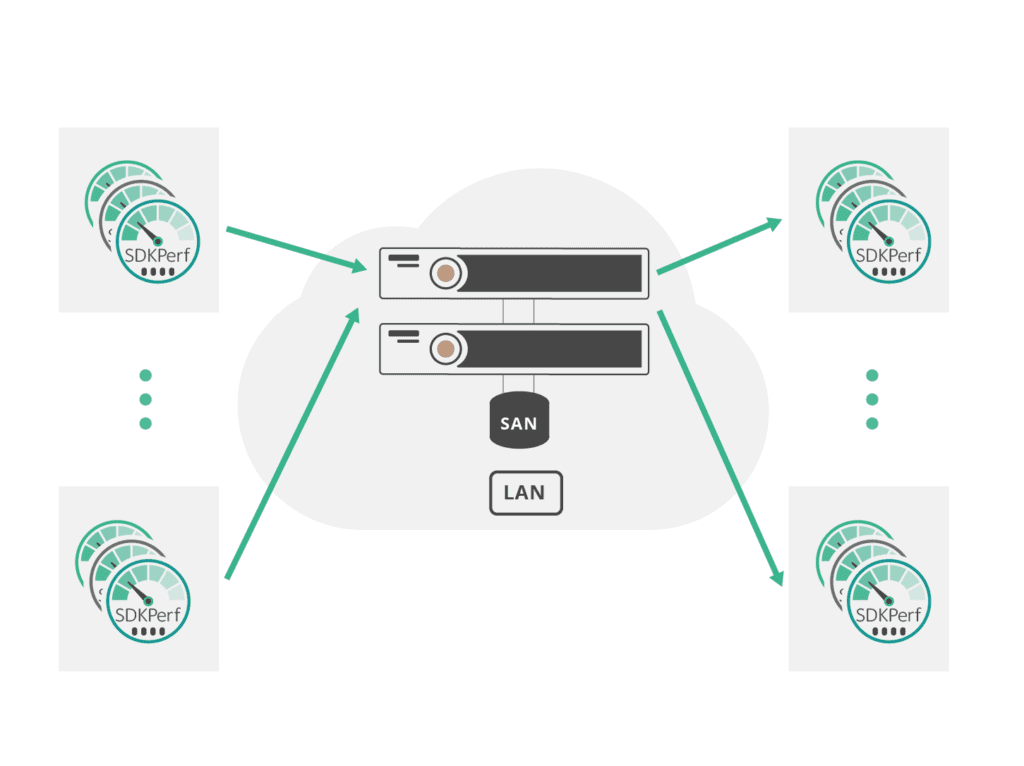
For the software results, a VMware ESXi server was used to host the Solace Event Broker VM image. For these scenarios, fewer test hosts were required for the traffic generation due to the difference in the performance capabilities.
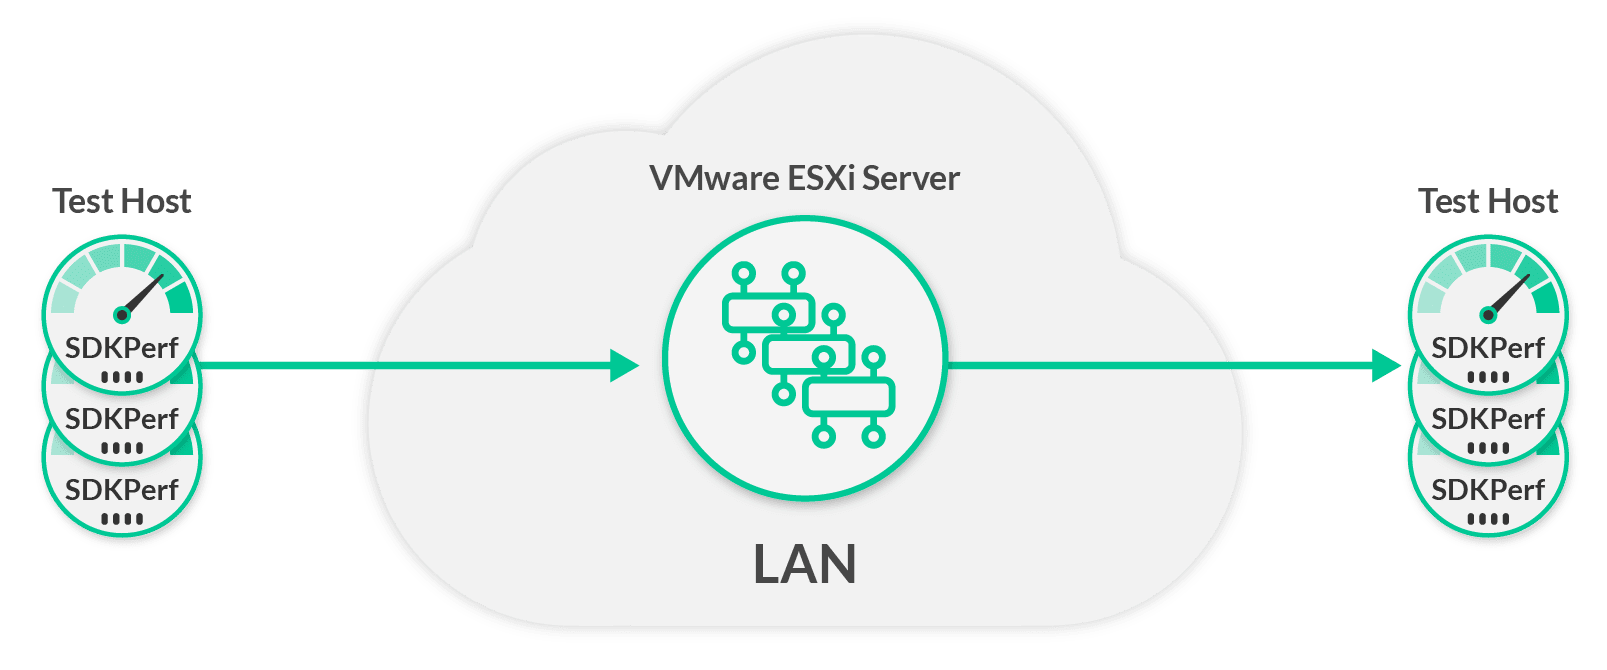
In both cases, a Mellanox SX1016 10GigE Ethernet switch was used to provide the LAN connectivity.
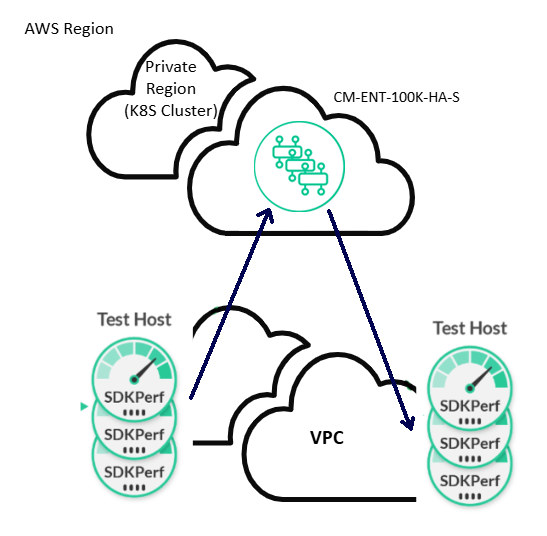
For the Cloud results, a CM-FDN-ENT-100K-HA service was deployed in private region in AWS. That service uses a r6in.4xlarge instance type to deploy the message-rouging nodes of the broker’s HA triple. The test hosts and infrastructure were deployed in a separate VPC from the brokers but, are deployed in the same AWS region.
The following tables give the full details of each of the hardware used in testing.
Solace Event Broker Software (ESXi)
| Platform | Solace Event Broker Software; Enterprise Edition |
|---|---|
| Hypervisor | VMware ESXi, 6.5.0 |
| CPUs | AMD Ryzen 9 3900X @ 3.80GHz |
| Memory | 64 GB |
| Datastore | Corsair Force MP600 2TB NVMe SSD |
| Network Interface | Intel Ethernet Converged Network Adapter X540-T1 (10G) |
| VM Settings | 8 cores, 48 GB RAM |
| API | All tests use Java clients (Solace JCSMP API) |
Solace Event Broker Cloud (AWS, 100K Service)
| Platform | Solace Event Broker Cloud |
|---|---|
| Amazon EC2 Instance Type | r6in.4xlarge |
| Datastore | gp2 EBS Volume – 1000GB |
| Networking | Enhanced Networking enabled |
Solace Event Broker Appliance
| Solace Event Broker Appliances | |
|---|---|
| Platform | Solace 3560 |
| NAB (I/O Card) | NAB-0810EM-01-A (8x10GE) |
| ADB (Guaranteed Messaging Card) | ADB-000004-01-A (ADB-4) |
| HBA Connectivity | HBA-0216FC-01-A (16Gb) |
| Product Keys | GM650K Performance Key |
| Storage Area Network (SAN) Characteristics | |
|---|---|
| Controller | Dell ME5024, Dual Controller |
| RAID | ADAPT with 12 drives |
| Drives | Serial Attached SCSI (SAS), 10K RPM |
| Connectivity | 16 Gbps Fibre Channel |
Required Test Equipment
Up to 16 performance test hosts were used to generate and sink the required message rate for the various scenarios. They all had characteristics that matched the following specifications:
| Performance Test Hosts (Load Generation Hosts) | |
|---|---|
| CPU | Intel Core i7-3930K CPU (6 cores) @ 3.20GHz (HT Disabled) |
| Memory | 16 GB |
| Network Interface | Ethernet Converged Network Adapter X520-DA2 (10 GigE) |
Connecting all the equipment together with a Mellanox 10GigE Ethernet Switch.
| Ethernet Switch | |
|---|---|
| Model | Mellanox SX1016 |
| Description | 64-port non-blocking 10GigE Ethernet Switch |