
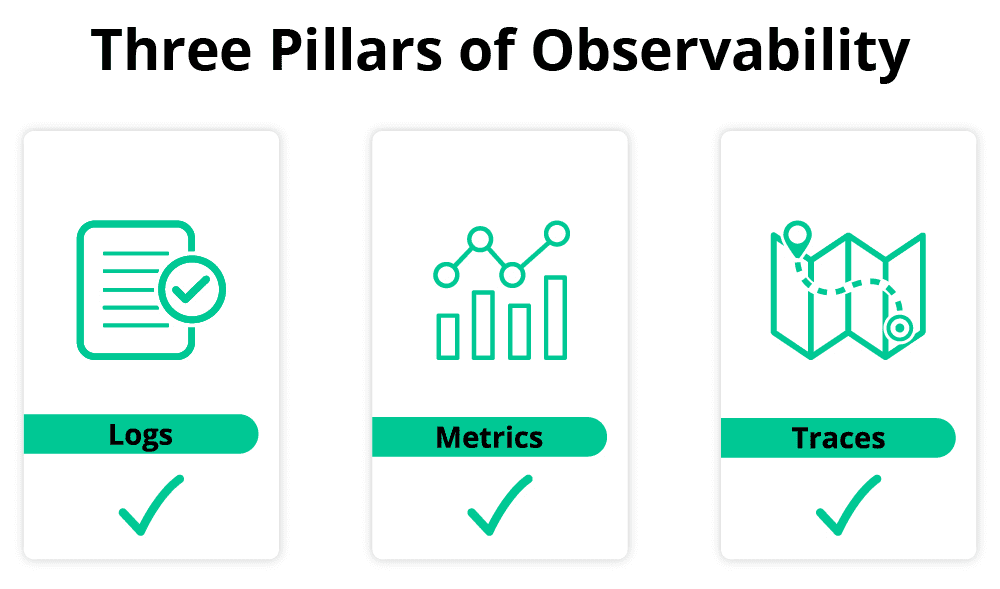
Distributed tracing falls under the umbrella of application performance monitoring and observability along with traditional metrics and logs. In this respect, some may consider “observability” to be monitoring on steroids; which is not far from the truth.
Solving the “unknown unknown’s” conundrum
Observability lets you understand a system from the outside, by letting you ask questions about that system without knowing its inner workings. This allows you to easily troubleshoot and handle novel problems to answer the question, “why is this happening”.
Source: OpenTelemetry.io
Why do organizations use tracing?
Microservice application development is efficient, scales well, works globally, and allows for shared workloads across clouds. This comes at the cost, however, of easy system-wide observability and can introduce the inefficiency of duplicate workloads or data and resource replication. It also can make it more difficult to mitigate problems in large, complex systems that use multiple stacks and have been coded by multiple teams. Adding distributed tracing to logs and metrics lets organizations more rapidly identify and mitigate problems.
But distributed tracing is about more than solving problems as they come up. At a strategic level, it lets you evaluate and optimize complex systems so you can improve performance, reduce costs, and improve user and customer experience.
This e-book provides an overview of four key activities that organizations embracing event-driven architecture (EDA) can leverage distributed tracing to deliver the aforementioned benefits:
How Distributed Tracing Identifies Individual Events
Keeping it simple, a distributed trace takes elements of information from individual services that are running in distinct locations and environments (i.e. distributed) and weaves them together to form a picture of what happened during a particular business process. The end result is graphical, searchable, and can be analyzed by both humans and machines. This lets organizations not only monitor whole systems, but track the progress of individual pieces of data as they traverse the system.
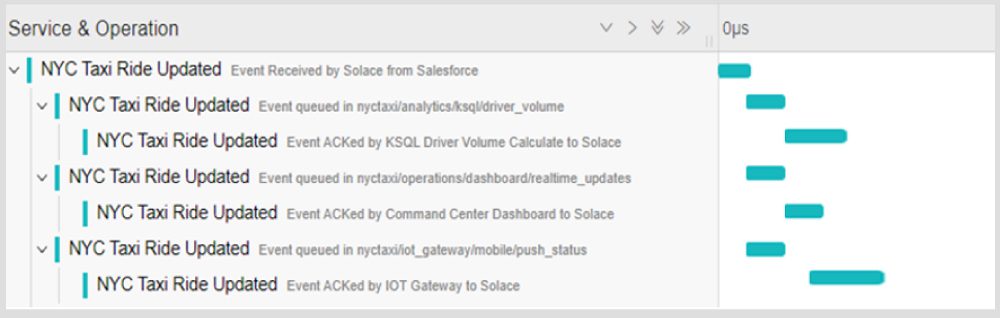
Distributed tracing applied to a taxi application where context is maintained from the parent application and carried asynchronously between the consuming events.
Distributed Tracing in Event Driven Architecture
Event-driven architecture (EDA) is a software design pattern – a modern form of message-oriented middleware if you’ve been around the IT space for a while – , in which applications can publish and subscribe to events via an event broker.
EDA lets information flow between applications, microservices, and connected devices in a real-time manner as events occur throughout the business.
By introducing a middleman known as an event broker, EDA enables what’s called loose coupling of applications, which means applications and devices don’t need to know where they are sending information, or where information they’re consuming comes from.
This loose coupling makes tracing more complex because a business process is not the synchronous, linear flow often seen with REST. Instead, information can be sent to multiple consumers at once, and processed asynchronously. This flexibility makes organizations more efficient, but also underscores the importance of observability over the systems. Distributed tracing faster debugging and proof of delivery and of routing for compliance.
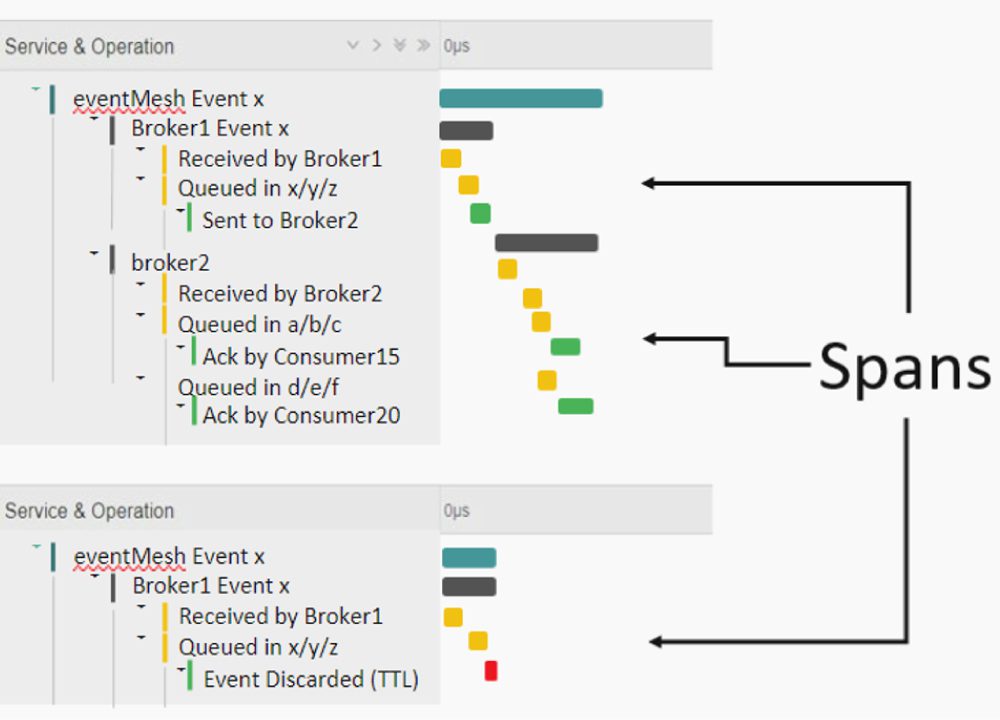
3 Key Concepts of Distributed Tracing
There are three terms you need to understand in order to understand the operation, purpose and value of distributed tracing:
- A span is a single unit of work or application operation. A span include the time it took one segment took to complete, and can also contains additional contextual information about what occurred and why.
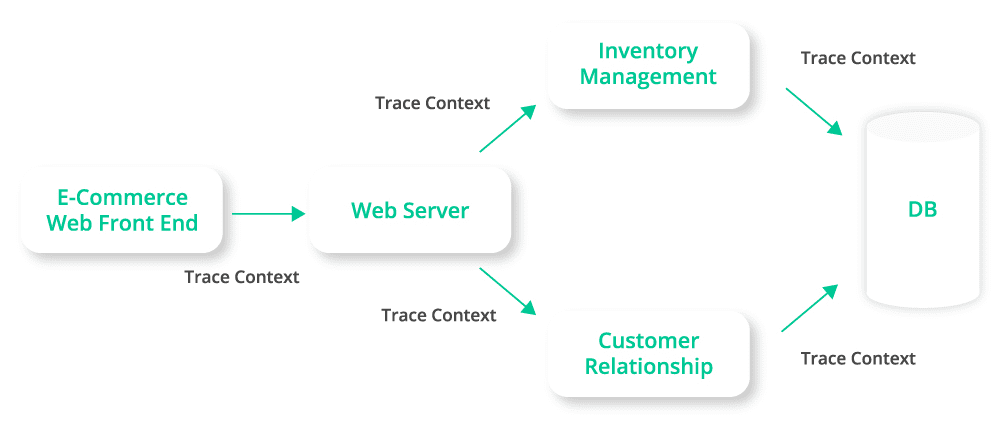
- Trace context contains the trace identifier (a unique ID) and metadata for the trace.
- Propagation is the moving of trace context from service-to-service, and can be achieved via a wide range of protocols such as REST, AMQP, MQTT, etc.
This is how distributed tracing may look in a very simple flow using a RESTful architecture to connect applications distributed across a few application domains.
For distributed tracing to work in an enterprise you need:
- Applications that can produce spans that describe what happen at each step of the process
- A way of creating and propagating the context throughout the business process
- A database (or other storage) to receive and persist the spans
- A front-end application for correlating, searching and analyzing the spans
- A broadly accepted way of tracing that maintains vendor neutrality across all the tools and technology that need to interconnect
Introducing OpenTelemetry
![]()
OpenTelemetry delivers on the five needs of an enterprise system described above. It is one of the most popular Cloud Native Computing Foundation (CNCF) projects. It is 100% free and open source and consists of tools, APIs , and SDKs that are used to generate collect and export telemetry data.
OpenTelemetry integrates with popular libraries and frameworks like Spring, ASP.Net, Express, Quarkus and more. It is lightweight for keeping persistence costs low and it is broadly supported by every vendor that delivers the back-end visualization tools that development and operations teams rely on such as Datadog, ELK, Splunk, Dynatrace, and more.
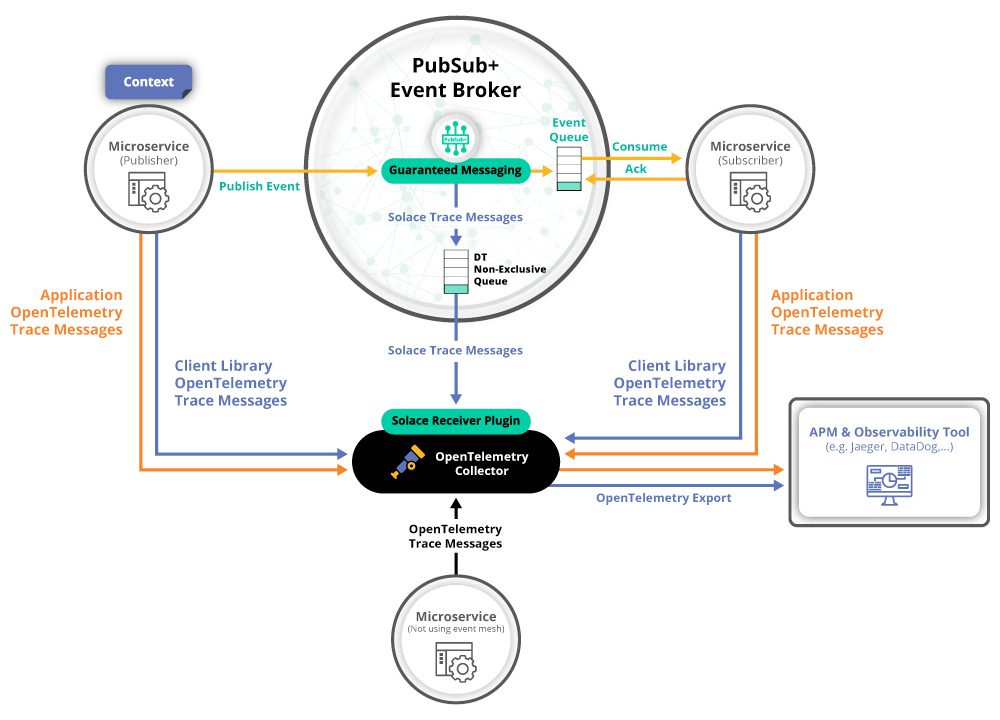
Putting it All Together for EDA
PubSub+ Event Brokers can fully participate in an OpenTelemetry trace, opening what has historically been a “black box”. Instead of only tracing the input and output of a broker, PubSub+ offers true end-to-end observability by exposing detailed information about what occurs within an event mesh.
In order to deliver the OpenTelemetry data, the event broker publishes spans to an OpenTelemetry collector. Organizations can run a single collector that receives spans from multiple sources or they can run multiple collectors that then forward specific data to the data store and/or back end tools. The architectural decision about what and where to deploy collectors is really up the needs of the organization and the use case, but the important part is that the solution is flexible and scalable.
If you only instrument via the client application then you are putting the onus of reporting the problem on the guilty app.”
Jesse Menning,
CTO Group Architect, Solace
The OpenTelemetry Collector consists of several components that can further enhance the observability of the systems. You can learn more at opentelemetry.io.
Distributed Tracing in EDA: Troubleshooting
Reduce MTTD and MTTR with end-to-end observability to pinpoint the problem faster and eliminate finger-pointing.
Quickly detecting and pinpointing problems with the delivery of information is critical to successfully troubleshooting issues with business processes. Unfortunately, when troubleshooting a problem across teams and geographies there is often a ‘fog of war’ that causes various individuals and teams to make incorrect assumptions, take wrong paths, or present inaccurate or incomplete conclusions. With distributed tracing, you can avoid finger pointing and quickly get to the root cause.
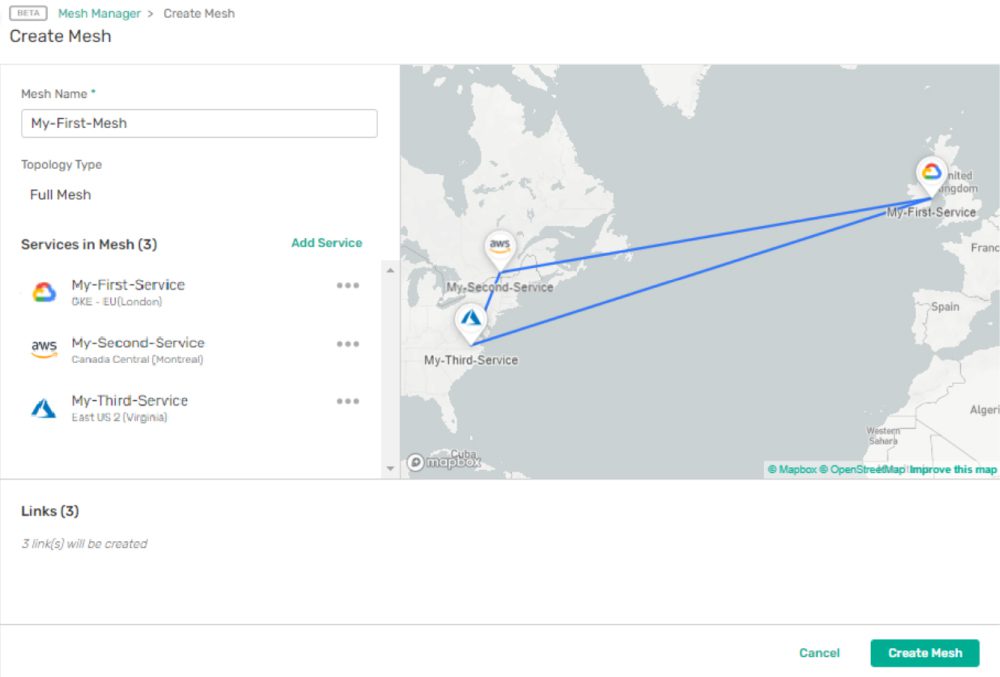
For example, take an online ordering use case in an event mesh covering three broker locations in AWS cloud locations. Order management is processed close to the operations center while the e-commerce brokers are located close to the regions the orders are being taken. As events they have order intake and order processes moving over the event mesh – payment information doesn’t transit the mesh but inventory details do.
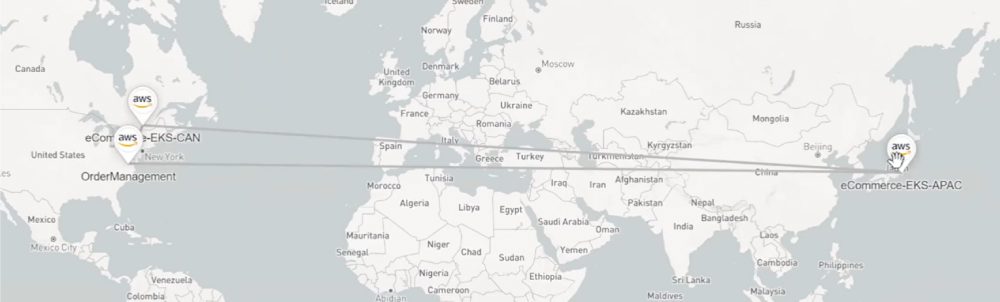
Order intake flowing over the event mesh to order processing at left. Orders not flowing to the destination right.
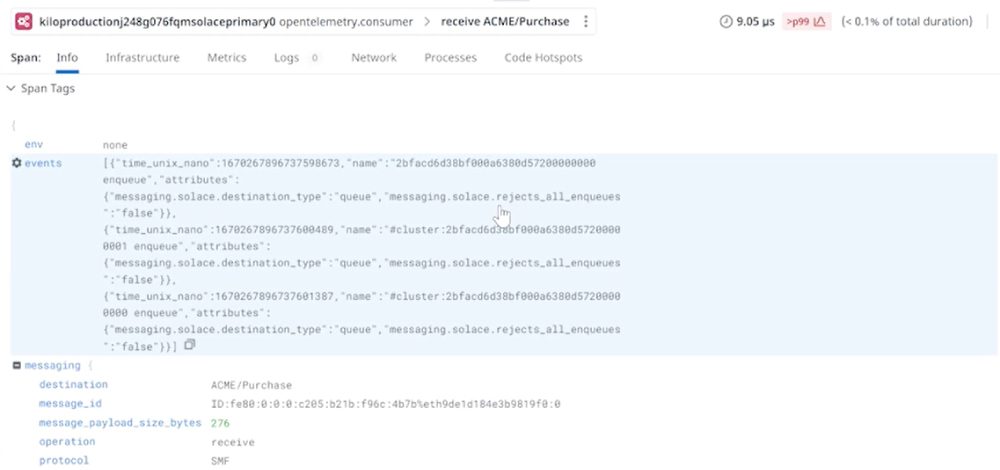
Since all the consumer queues are listed in the traces, it’s fairly easy to discover which apps are consuming which messages. And remember that the middleware manager who is investigating the cause was not on the team that built the applications or published the catalog of events for use across the organization.
By examining the queue, you can see which applications have registered for and received the message. In this case, the message topic does not match the queue subscription. Without distributed tracing, tracking down the problem in a distributed system would be complicated, and in a production environment that creates all kinds of problems.
Distributed Tracing in EDA: Debugging
Reduce development time with faster root cause analysis in complex microservice environments.
Debugging is a subset of troubleshooting, and for the purposes of this piece refers to identifying problems during the development of new applications, but sticklers for process will understand that debugging is also part of troubleshooting.
During microservice-based application development, tracing allows for code optimization and error detection. Because it is distributed end-to-end, it is easier for IT and DevOps teams to thoroughly pinpoint problems and potential bottlenecks by monitoring a request as it travels through a system.
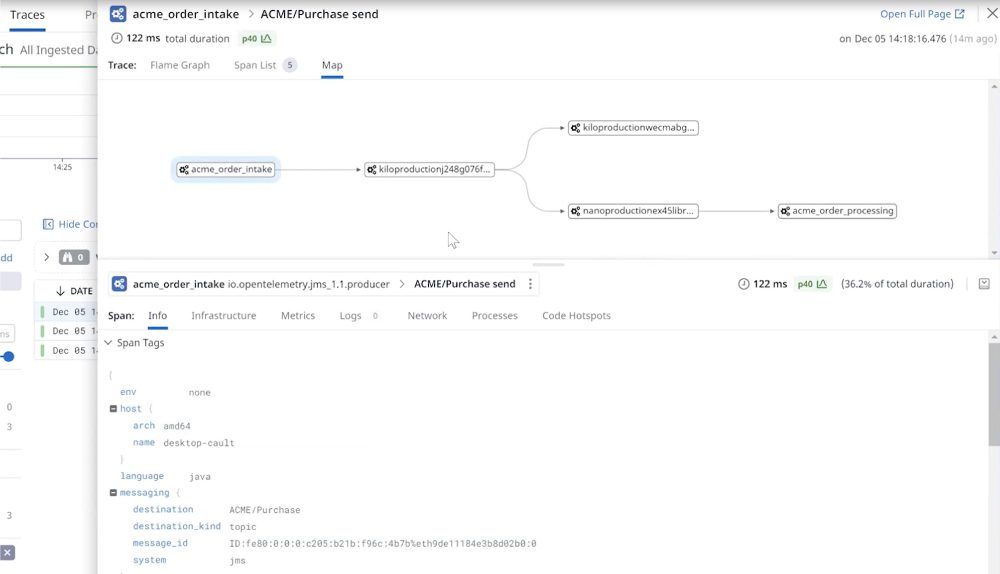
Why aren’t logs enough? The distributed nature of microservices, combined with automatic scaling of services, means you can have multiple instances of services running on different servers, locations and platforms. It makes tracking individual requests extremely time consuming – if not impossible. In this example you have events flowing between multiple applications that can in turn be made up of multiple microservices that can in turn be running multiple auto-scaled instances.
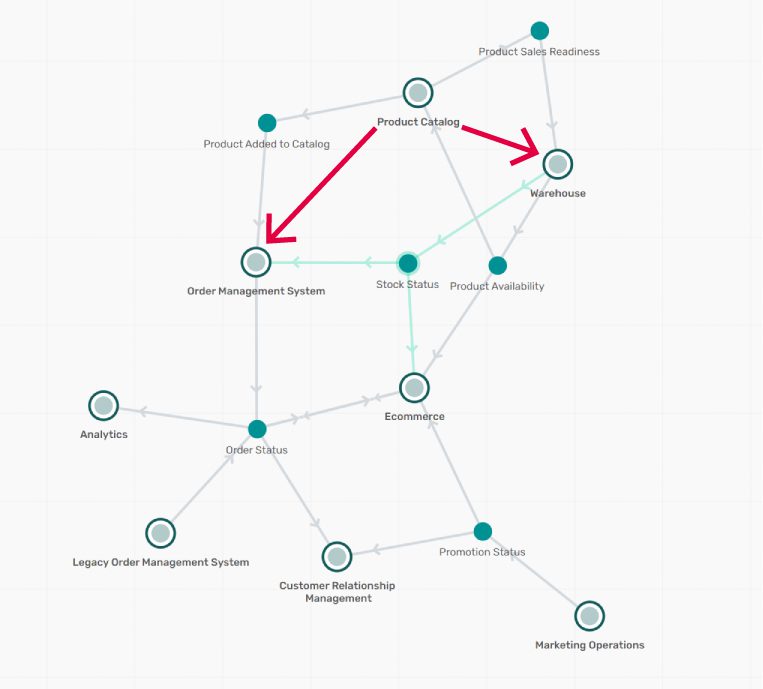
This modelled architecture shows that complex event driven architectures. Tracking a catalog update to the order management system and warehouse can occur in one trace analysis. Tracking the next step to the availability engine and the e-commerce engine is simply another addition to the trace context.
Debugging in a broker like Kafka or Pulsar requires intercepting the message data (typically at the API layer) and adding the tracing information. This approach introduces overhead and yet another codebase to manage. By leveraging EDA to send trace messages to a queue with PubSub+ event brokers, you improve performance and reduce complexity. Additionally, an interception approach doesn’t give any telemetry on the brokers themselves. If you are routing events globally you won’t get telemetry on what is happening in the messaging layer. This means you don’t have a way to quickly analyze how events are being distributed through the mesh, and swiftly determine if an issue lies with an event’s producer or consumer.
Distributed Tracing Example
Let’s consider an example of an online game that recommends in-app purchases for players based on their activity. Perhaps one team is deploying data in a batch process that takes one minute to produce the latest purchase options.
If the team producing the batch changes their algorithm and now the batch takes 1.5 minutes to execute. The receiving applications may still process data on a minute-by-minute basis. The engine is now bringing in obsolete events to make recommendations. Without knowledge of each other’s activities the engineering and data teams end-up with incorrect recommendations to the customers playing the game. This manifests itself in lower sales conversions – something that can take a long time to try and debug and understand.
More importantly, this may not even trigger a technology alert .or even get noticed when it manifests itself much later in lower sales volume. That result could get blamed on a business-processes, the art department, or the game producer – none of which were the cause of the issue.
This scenario could play out in bricks-and mortar location-based shopping with targeted advertising, in e-commerce for online retailers, accuracy in financial services product pricing, and more. But detecting and solving these kinds of problems is part of the promise of observability.
One other consideration for debugging is that some applications aren’t going to be instrumented for telemetry including:
- Lightweight IoT projects where it isn’t practical to add telemetry overhead to devices or equipment.
- Development teams that don’t have the needed resources to add telemetry to an existing legacy application
- Software as a Service applications that don’t support OpenTelemetry
Instrumenting events as they enter and transverse the event mesh can provide a significant level of observability into these scenarios. This is beneficial when you are integrating systems that include both telemetry-enabled and non-enabled services.
Distributed Tracing in EDA: Monitoring and Optimization
End-to-end application performance monitoring to detect and resolve bottlenecks faster to lower costs and improve UX.
As DevOps and IT Ops teams standardize on the use of OpenTelemetry then it improves the value of tracing because business metrics can be used along with the tracing data. Tracing in general applies to more than just code and can also detect process delays such as order times, fulfillment, etc. However, in EDA it is more relevant to focus on the distribution of the events.
Monitoring and optimization of events traversing the mesh can use the change in the trace length across sources and to a wide variety of popular monitoring tools.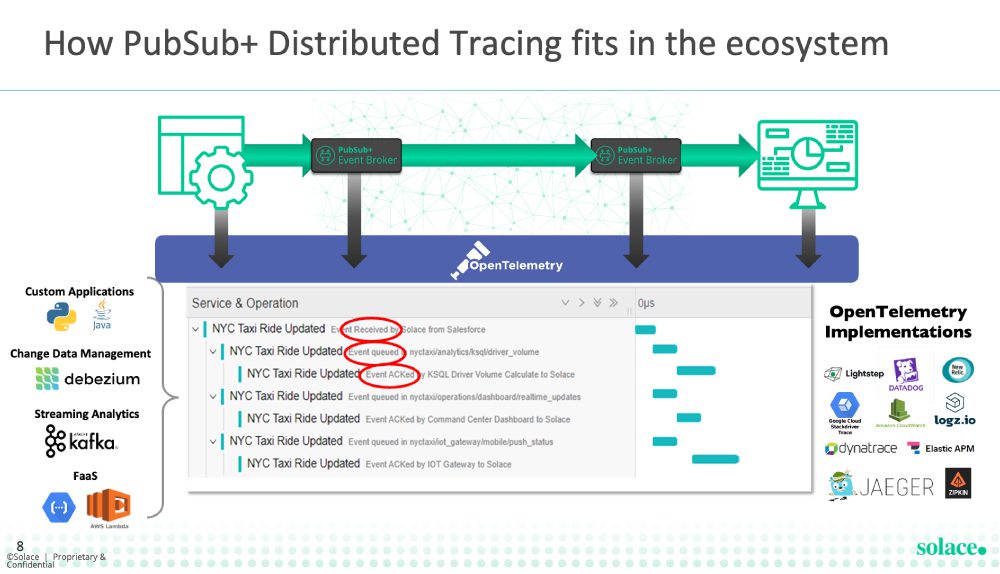
At its simplest, distributed tracing can detect increased latency in the span length, but if costs or revenue can be associated in the monitoring tool then the impact of design decisions can be better compared. For example, if a CTO has limited resources and needs to decide whether to increase the number of AWS EC2 instances or to spend that time optimizing code (anywhere in their system), they can look to the metadata on the traces to determine where to most efficiently apply the resources. Similarly, you can use observability on the event mesh to determine when events are being published but not consumed.
Traditional monitoring of an event-driven system is not much different than other applications. You can use purpose-built monitoring tools typically used by the team managing the infrastructure or you can send logs to an operations center, or both. With this data, teams can track performance, be alerted when a system changes and analyze resource utilization to look for opportunities to optimize the system. In this way, adding distributed tracing to the mix is increasing the precision of the information for potentially faster and more specific responses to problems detected with monitoring.
Distributed tracing is at the code level in that the applications themselves are instrumented for it. In this way the operations center and development teams can use the data to optimize with much more granularity. This is why all of the APM vendors have jumped two-feet into supporting the OpenTelemetry standard.
And finally, with Solace PubSub+ the event brokers have complete logs, traces, and a monitoring solution providing the full observability solution for the event brokers in the mesh.
Distributed Tracing in EDA: Establishing Data Lineage
Reduces cost and effort to analyze complex systems, validate trusted data sources, prove delivery, and demonstrate regulatory compliance.
Data lineage is related to, but distinct from, observability. There are even two overlapping standards for the two functions. OpenTelemetry is mature and deals with APIs, discoverability, event flows, availability, and latency, while OpenLineage is newer and defines dataset quality, transformations, schemas, and catalogs. There are also different companies that offer solutions for APM vs Lineage.
To contrast them, services use distributed tracing to understand and mitigate distributed failures by understanding the dependencies between the services. On the other hand, data pipelines use data lineage to understand how datasets are consumed and produced and the transformation of that data to understand data errors. The two practices overlap in cataloging the steps from point A to point B, and in providing proof of delivery.
Some broker technologies transform message body contents and schemas, which can have scaling problems even without tracing overhead. This kind of intense transformation can best be resolved in a more distributed fashion in the client where extracting, inserting, and modifying message body contents is common.”
Rob Williamson,
Product Marketing Manager, Solace
The event brokers role in lineage
With EDA, event brokers are responsible for the routing of the events, while transformation occurs at the application layer that is specifically designed for it. While some broker technology can be used to transform data, this is generally not the ideal approach for a few reasons: First, that’s not what event brokers were designed to do; second, that creates another black box problem for debugging;and third, you can’t effectively observe data lineage if it isn’t natively enabled. Combining transformations with observability of lineage reduces the efficiency of resources and increases the cost for ongoing management.
For data-level lineage observability the analyst may concern themselves with analyzing the quality of a data source. For instance, if a company is translating revenue numbers between different currencies. For the event level lineage what is needed is proof that the event occurred, that it occurred efficiently, and the source(s) and destinations.
Lineage for Compliance and audit with the where and when proof of delivery
A common use case for lineage is proof of delivery for sake of regulatory compliance. For compliance, tracing can be used to track the sources and destinations of the data. It can also be used to document and audit compliance. The data producer needs to be able to definitively state that they published something and that something else consumed it. These are not part of day-to-day operations for most organizations. When they are needed for things like regulatory compliance on data sources and destination or analyzing active cyberthreats, tracing makes finding and producing the logs cost significantly less time and resources. If the event brokers are a black box, then there is no way to show true end-to-end lineage. There is also no way to document the compliance for teams that need it – be it finance, operations, cybersecurity, or others.
PubSub+ Distributed Tracing helps in two ways.
- Making it easier to ensure compliance when connecting brokers across jurisdictions where topic routing and access control list define where data and events can flow.
- Tracing also adds another level of observability on the flow of controlled data types like PII when infrastructure is shared. It can be used to audit the data, to provide compliance data, and to track if that data is consumed by one microservice and then accidentally re-published somewhere it shouldn’t be.
Data lineage can help to quickly track when data crosses borders or different clouds in multi and hybrid cloud global deployments. It can also prove that it can’t and doesn’t transit jurisdictions.
Performance Considerations
To trace events, the telemetry data needs to egress the system, get stored somewhere, and be accessible for monitoring and analysis– — all of which require resources. Organizations need to capacity plan for this just like any other monitoring solution.
A key benefit of PubSub+ is that since telemetry is enabled natively in the broker, there’s less system impact than running code in the microservices or adding client applications to collect and forward traces. Our lab analysis has shown that for most use cases, the telemetry only required a small bump in capacity on individual brokers. However, if you have a very high volume of very small messages, you are effectively doubling the message count – one for your event and one for your trace and so capacity needs to be planned for those scenarios.
Therefore, when planning for observability the key is to do it intelligently by streamlining the trace production, making it asynchronous, and being selective about what you are tracing and/or storing and at what stages.
- Evaluate you use case.
- Document trade-offs between what you need to observe and its systemwide resource cost
- Select technologies that are mature in optimizing OpenTelemetry
- As it relates to event brokers, include overhead estimates and use flexible capacity licenses as you scale up your projects.
Conclusion – Putting it all together
70% of microservices development will be instrumented with OpenTelemetry by 2025.”
Source: Gartner
Observability is rapidly evolving from scrolling through individual application logs into sophisticated application performance monitoring solutions. The standardization of OpenTelemetry has enabled teams to both generate and analyze large sets of trace data. They can use this to power the observability that delivers faster and lower cost debugging, troubleshooting, monitoring, and analysis of data lineage.
Embedding distributed tracing capabilities into event brokers delivers the detail and transparency needed for true end-to-end observability of event-driven systems. Observability is the act of taking traces, logs, and metrics and using them to monitor operations and troubleshoot problems, but by taking it up a level you can also use it to optimize systems and processes by spotting inefficiencies. This is identified because it allows for end-to-end analysis where, in its simplest sense, inefficiencies show up as longer spans
The Only Platform Purpose-Built for Event-Driven ArchitectureThis promise is why OpenTelemetry is among the fastest growing Cloud Native Computing Foundation (CNCF) projects, and a hot topic at many conferences in 2023. Organizations looking to enhance decoupled microservices-based systems with distributed tracing can use Solace PubSub+ Event Broker to not only deliver end-to-end tracing, but to instrument services that aren’t currently enabled with OpenTelemetry by adding observability to the events they publish and consume.
Getting started is easy — visit Solace.com to download the latest version of PubSub+ Event Broker, which supports distributed tracing at no cost for development environments. For cloud-managed services, you can initiate a free trial today and contact us to enable distributed tracing on your managed service. And of course, our team of engineers is always here to help.