
Logs, Metrics, and Tracing for AI Agent Workflows in Solace Agent Mesh
You’ve built an agent mesh…tasks flow in, agents collaborate, results come back. It works! But when a response takes 12 seconds instead of 2, where did the time go? When an agent produces an unexpected answer, what prompt did it receive? When token costs spike on a Tuesday afternoon, which agent is responsible? These are observability questions. And they are harder to answer in an agent mesh than in a traditional microservices architecture.
Observability is Tricky in Agentic Systems
In a microservices system, you know the call graph in advance: Service A calls Service B and C, every time, in a predictable pattern. You instrument the paths, set up dashboards, and monitor. In an agent mesh, the execution graph is not known until it happens. An orchestrator delegates to specialist agents it discovers at runtime. LLMs are called with unpredictable latency. Tools are invoked based on reasoning, not routing rules. The number of steps, which agents participate, and how long each step takes can vary dramatically from one request to the next.
How Agent Mesh Offers Rich Observability
Solace Agent Mesh addresses this with observability that works at two levels: standard infrastructure-grade tools for production monitoring, and an agent-aware visual system purpose-built for debugging multi-agent workflows.
This post covers what Solace Agent Mesh provides across the three pillars of observability: logs, metrics, and tracing, and introduces the “dig as deep as you want” philosophy that ties them together.
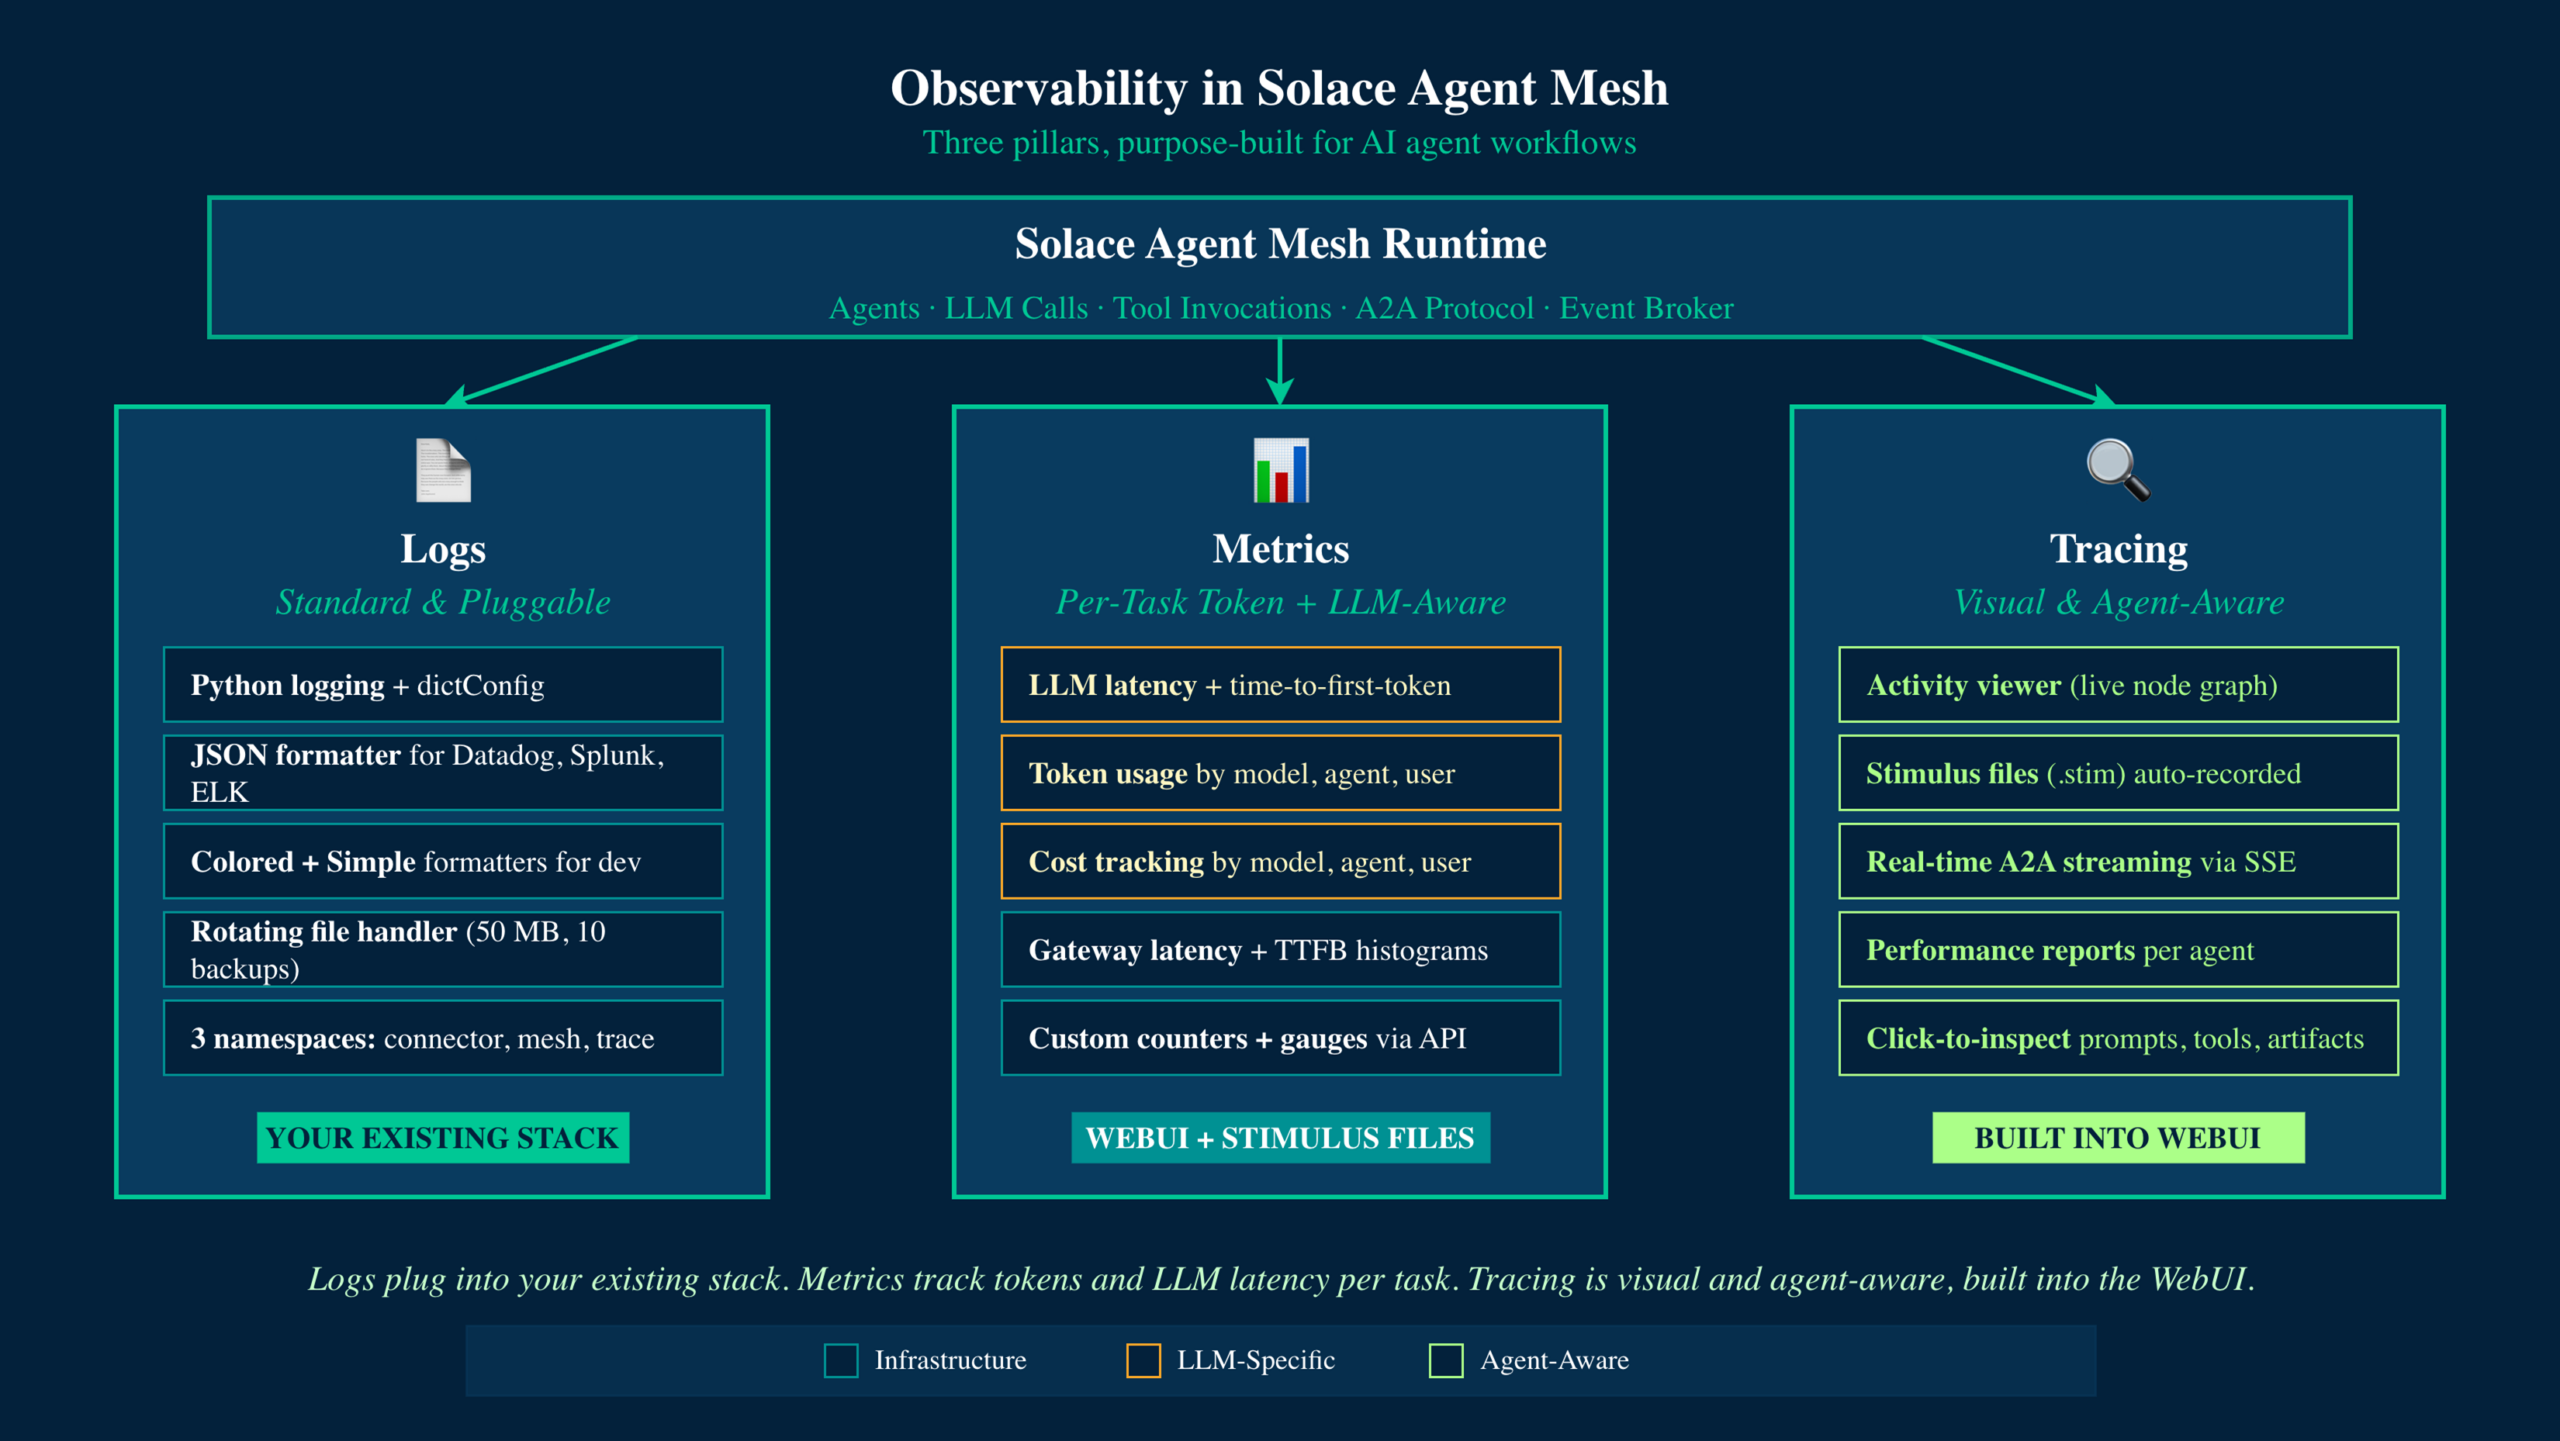
Figure 1: The Three Pillars of Observability in Solace Agent Mesh
Logs: The Familiar Pillar
Logging in Agent Mesh works exactly the way you would expect. It uses Python’s built-in module to provide flexible and powerful logging capabilities. You can configure it with the same YAML or JSON files you use for any Python application.
Three formatters are available out of the box:
- Simple: human-readable output with timestamp, level, thread, logger name, and message. Good for development.
- Colored: color-coded terminal output for quick visual scanning during local development.
- JSON: structured output via python Json logger for production environments. Feeds directly into Datadog, Splunk, Elasticsearch, or any log aggregation system that consumes structured JSON.
The JSON formatter supports static fields for adding context like service name and environment to every log line:
formatters:
  jsonFormatter:
    class: pythonjsonlogger.json.JsonFormatter
    format: "%(asctime)s %(name)s %(levelname)s %(message)s"
    static_fields:
      service: ${SERVICE_NAME, payment-service}
      environment: ${ENV, "production"}
Agent Mesh uses three logger namespaces: solace_ai_connector for the runtime layer, solace_agent_mesh for the framework, and sam_trace for detailed troubleshooting. Each can be configured independently, so you can run the framework at INFO level while setting a specific agent’s logger to DEBUG.
For file output, a rotating file handler ships by default with 50 MB rotation and 10 backup files. Environment variable substitution works throughout the config, so you can change log levels per deployment without modifying files.
The takeaway: logging is the one pillar that requires no learning curve. Plug it into your existing log aggregation stack and it works.
Metrics: LLM-Aware, Built into the WebUI
This is where Agent Mesh goes beyond traditional observability. Standard APM metrics track request latency, error rates, and throughput. Those matter in an agent mesh too, but they are not enough. You also need to know how much time the LLM spent thinking, how many tokens each request consumed, and what it costs.
Solace Agent Mesh tracks these metrics per task, automatically, with no external infrastructure required.
Stimulus Files for Analysis and Debugging
Every stimulus file (.stim) captures timing data for the full task lifecycle. Because stimulus files are structured YAML, you can parse them programmatically to extract latency distributions, token counts, and cost data across tasks. Teams that need to build dashboards or track trends over time can download the file (via REST API) or CLI and write custom scripts to extract timing metrics and feed them to existing analytics or visualization tools.
Token Usage Tracking
Every task records detailed token consumption: total input tokens, output tokens, cached input tokens, and a full breakdown by model and by source. This data is stored in the task database and visible directly in the WebUI. This data is stored in the task database and visible directly in the WebUI. For offline analysis, token usage details may also appear within the event payloads of downloaded .stim files when agents include this information in their A2A messages
This means you can answer questions like: how many tokens did this task consume? Which model was used? How much of the input was served from the cache? All from the WebUI, without setting up a separate metrics pipeline.
Tracing: Visual, Agent-Aware, Purpose-Built
Traditional distributed tracing follows a request through services using spans and trace IDs. That model works well for known call graphs. In an agent mesh, the call graph is dynamic. An orchestrator might delegate to two agents or five, depending on the question. Each agent might call an LLM zero, one, or multiple times. Tools are invoked based on the LLM’s reasoning, not predefined routes.
Currently, Solace Agent Mesh community edition does not use OpenTelemetry spans for tracing. Instead, it captures the full stimulus lifecycle by recording A2A messages as they flow through the Solace event broker. These events are stored as .stim files and can be visualized in the WebUI’s activity viewer, which reconstructs multi-agent interactions into flow diagrams. Because the system is event-driven and all communication passes through the broker, capturing the complete execution path requires no additional instrumentation.
For enterprise deployments Solace Agent Mesh will offer native OpenTelemetry integration with a Prometheus-compatible /metrics endpoint. This upcoming capability will enable direct ingestion of agent health, performance latencies, and LLM usage metrics into your existing observability stack-Datadog, Grafana, Dynatrace, or any OTEL-compatible platform.
The Activity Viewer
The centerpiece is the activity viewer in the WebUI. When you send a task to the agent mesh, the Activity view shows you the live execution as an interactive node graph.
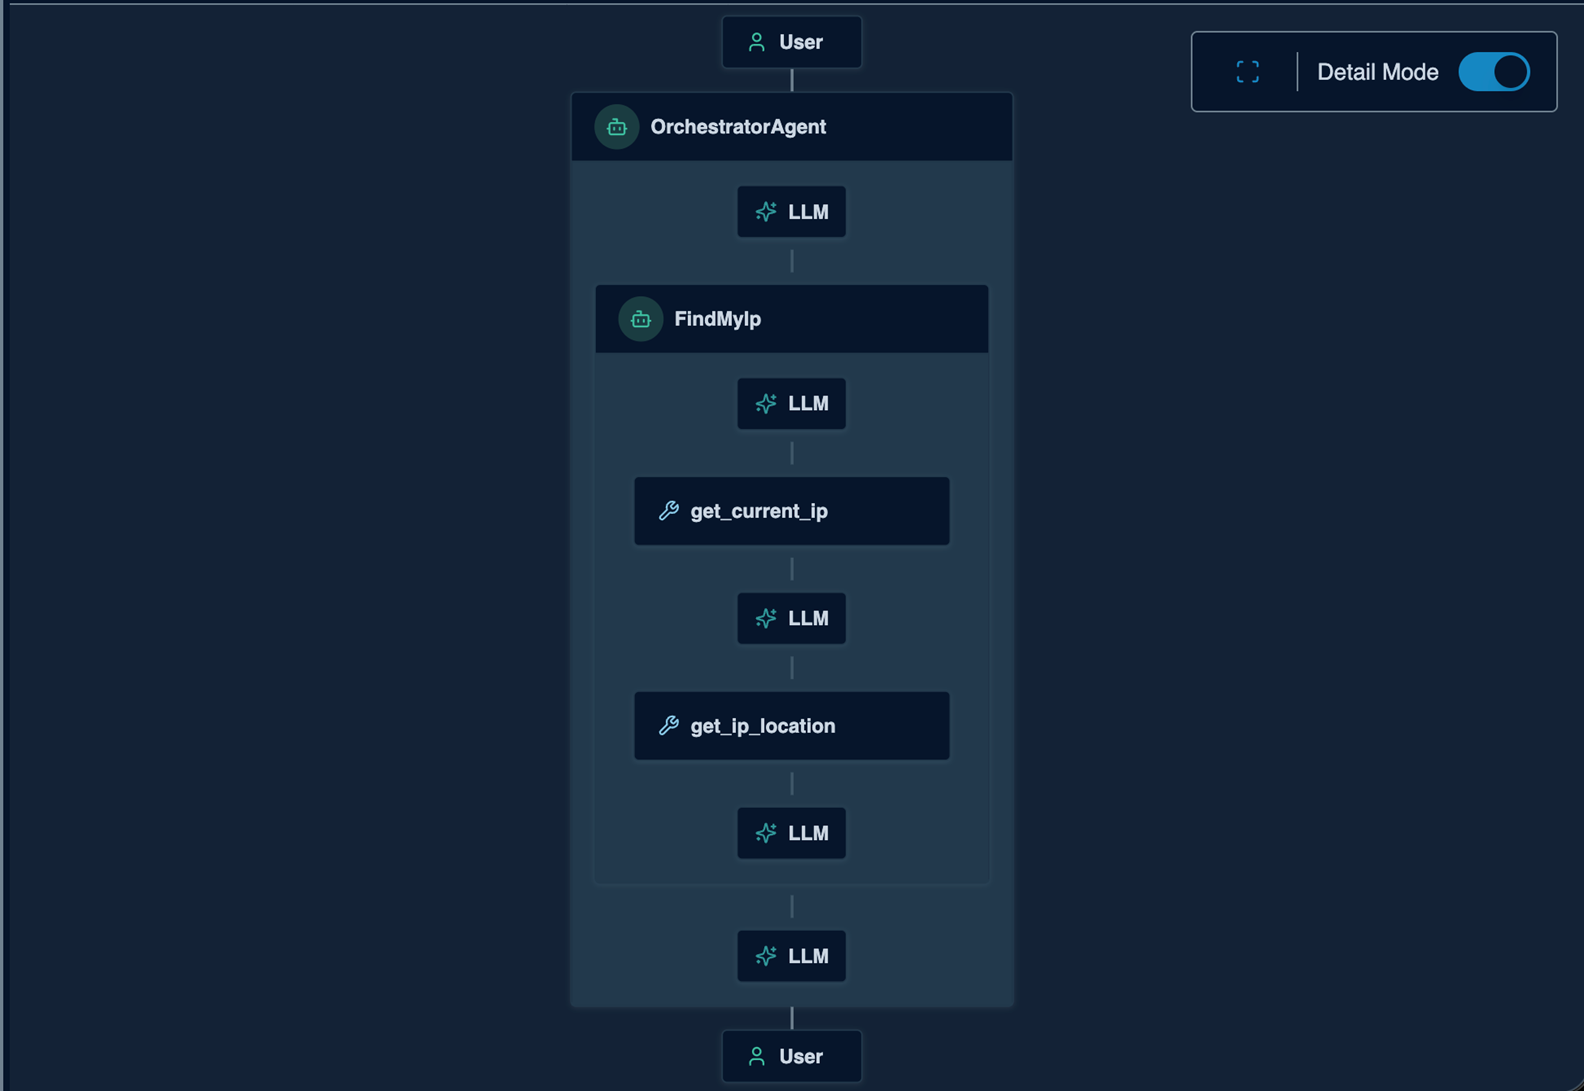
Figure 2: The Activity Viewer showing a multi-agent task execution
Each step in the execution is a node. Common node types include:
- User nodes mark the start and end of stimulus. The top node shows the input as it enters through the entrypoint, and the bottom node shows the final response delivered back.
- Agent nodes represent each agent that participated, with nesting for peer delegations.
- LLM nodes show individual LLM calls with the model’s name.
- Tool nodes show tool invocations with artifact counts.
- Control flow nodes show conditional branches (Switch), iteration loops (Loop), and parallel fan-out (Map).
- Workflow nodes show structured multi-step workflows and parallel execution blocks.
Additional node types may appear depending on your configuration.
You can toggle between a collapsed overview and full detail mode that shows nested agent internals. Click any node to inspect the actual data: the LLM prompt, the tool arguments, the artifact content, the raw response. Processing indicators show animated halos on nodes that are still in progress.
Real-Time Activity Streaming
For live debugging, the WebUI provides a real-time SSE feed of A2A messages as they flow through your agent mesh. This is powered by the Solace event broker at the heart of Agent Mesh, which uses a hierarchical topic structure for all agent-to-agent communication. Every interaction-requests, responses, status updates-is published to structured topics following patterns like:
| Purpose | Topic Pattern |
|---|---|
| Task Requests | {namespace}/a2a/v1/agent/request/{agent_name} |
| Status Updates | {namespace}/a2a/v1/gateway/status/{gateway_id}/{task_id} |
| Final Responses | {namespace}/a2a/v1/gateway/response/{gateway_id}/{task_id} |
The WebUI’s activity viewer taps into this live message flow, displaying each event as it occurs. For broader monitoring, you can subscribe directly to the Solace event broker using wildcard topics like {namespace}/a2a/v1/> via tools such as the Solace Try Me VSCode Extension, Solace Try-me CLI or the Broker Manager’s Try Me! tab. This lets you scope the stream to all messages in a namespace, messages to a specific agent, or any slice you need—all through topic filtering, with no custom instrumentation required.
This is the power of event-driven architecture and publish-subscribe messaging: the broker already carries every interaction, and Solace’s topic-based routing gives you precisely the visibility you need.
Performance Visualization
The WebUI computes performance details from the activity data: per-agent LLM call durations, tool call durations, parallel execution grouping, and total task duration. This helps you identify which agents and which models are contributing to the most latency.
Dig As Deep as You Want
The philosophy behind Solace Agent Mesh’s observability is layered depth. You start with the simplest view and drill down only when you need to.
- Surface. You ask your agent mesh a question and get an answer in 3 seconds. Everything looks fine. Move on.
- One level down. A response takes 12 seconds. Open the Activity view. You see the Orchestrator delegated to two specialist agents. One returned in 200 milliseconds. The other took 11 seconds. Now you know where to look.
- Deeper. Click the slow agent’s LLM node. You see the prompt, the model (GPT-4), and the token count (8,200 input tokens). The prompt is bloated. Maybe the context window is carrying too much history.
- Deeper still. Check the performance report. This agent’s LLM call durations have been climbing. Compare token counts across recent tasks. The context window is growing with each session. This is not a one-off. Something changed.
- Deepest. Download the .stim file. Every A2A message in chronological order. Trace exactly where time was spent. Compare it to a stimulus file from last week when latency was normal. Share both files with your team.
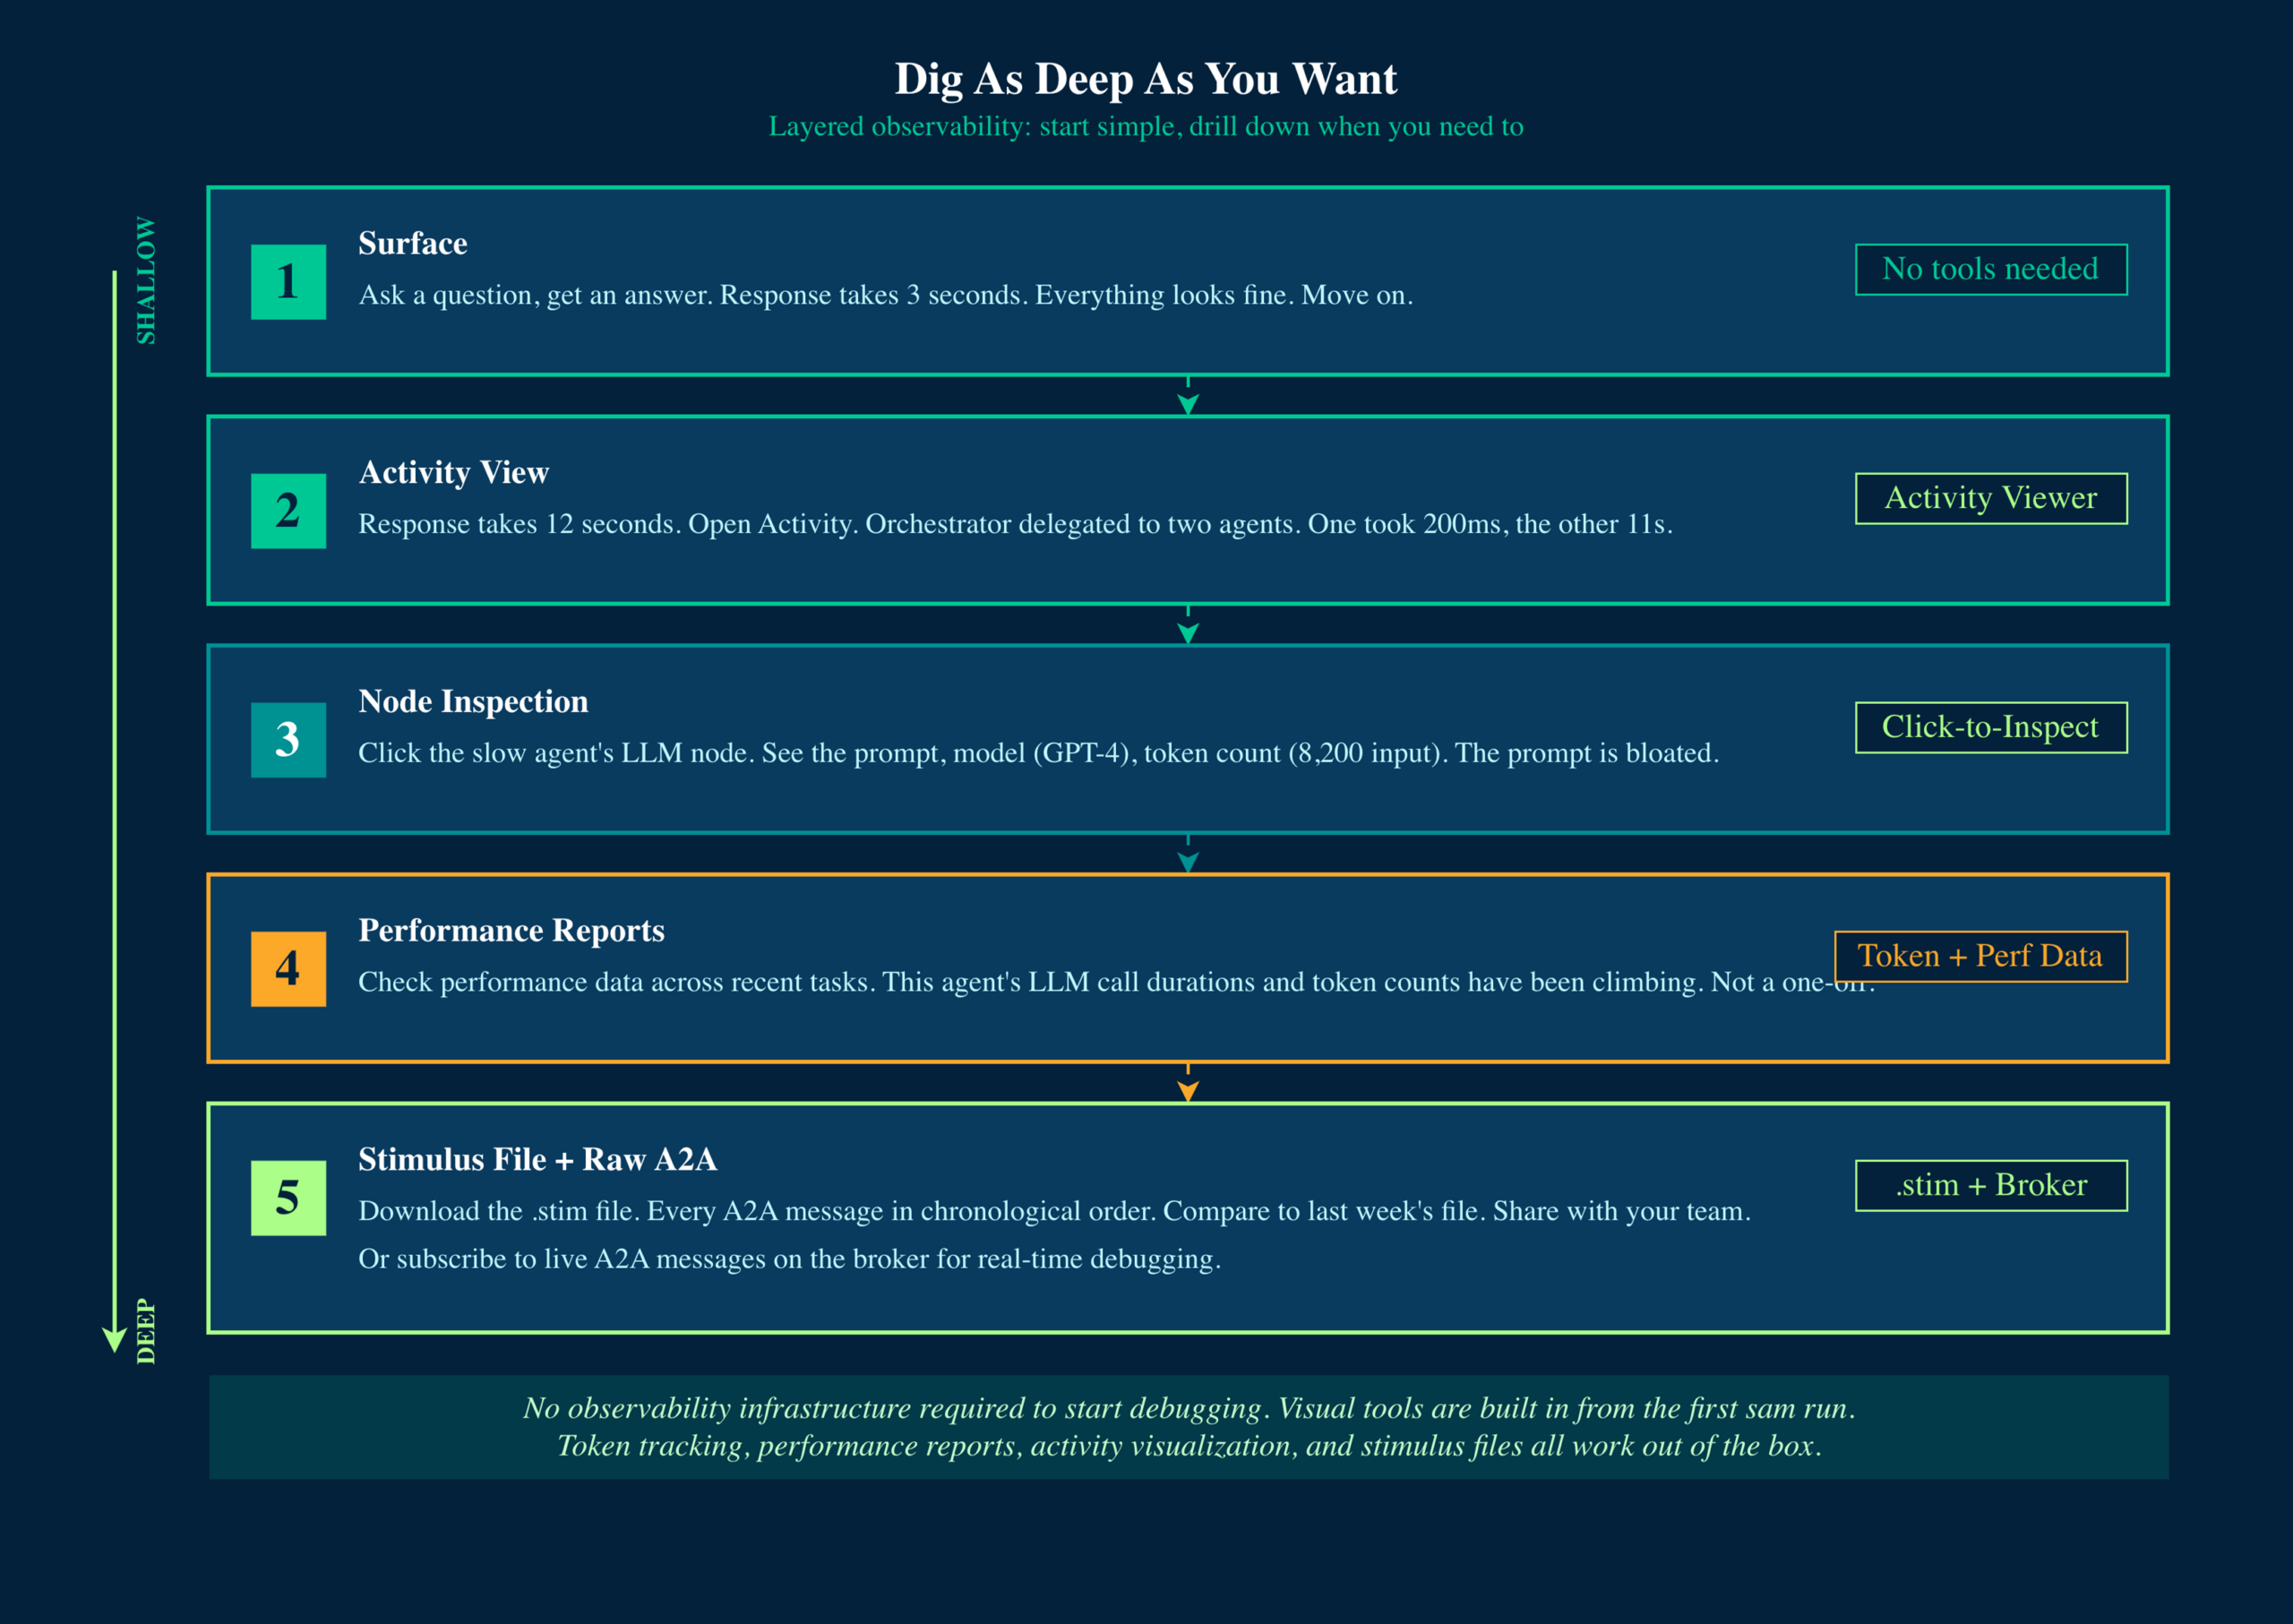
Figure 3: The layered depth philosophy of observability in Solace Agent Mesh
You do not need to set up observability infrastructure to start debugging. The visual tools are built in from the first solace agent mesh run. Token tracking, performance reports, activity visualization, and stimulus files all work out of the box.
What This Means for Your Agent Mesh
Observability in an agent mesh is not the same problem as observability in a microservices architecture. The execution graph is dynamic. LLMs introduce a new class of latency. Token costs are a first-class concern. Traditional tools cover part of the picture, but they miss the agent-specific dimensions.
Solace Agent Mesh’s approach is practical: logs work the way you expect; metrics give you per-task token usage and LLM latency data built into the WebUI, and tracing is reimagined as a visual, interactive experience built for the way agent meshes execute.
In upcoming posts, I’ll dive deeper into each pillar: configuring structured logging for production, working with token usage data and performance reports, and using the activity viewer and stimulus files to debug complex multi-agent workflows.
Explore other posts from categories: Artificial Intelligence | Solace Agent Mesh




Subscribe to Our Blog
Get the latest trends, solutions, and insights into the event-driven future every week.