Introduction
Modern enterprise architecture relies on a diverse ecosystem of specialized third-party products and appliances to create a reliable, stable, scalable, secure, and high-throughput application platform. This platform facilitates both stateless and stateful applications development to accommodate both Request-Driven Architecture (RDA) and Event-Driven Architecture (EDA) paradigms.
EDA’s decomposition of messages from batches into smaller, real-time and asynchronous events has dramatically boosted system throughput, scaling from millions of messages to billions of events. However, this increased complexity necessitates a more robust solution for monitoring and troubleshooting issues at the data flow level.
In my previous article titled “The Importance of Event Governance in EDA“, I explored OpenTelemetry as a solution for enabling distributed (end-to-end) tracing of event flows with RDA and EDA architectures. This article delves deeper, using an account enquiry request scenario to illustrate the limitation of traditional Application Performance Management (APM) tools in fulfilling distributed tracing needs. It then showcases the implementation of a new OpenTelemetry solution to overcome this challenge. (OpenTelemetry is more than just a buzzword; it is a robust framework for collecting observability data from cloud-native applications. This is the second most-active project under the Cloud Native Computing Foundation (CNCF). More details can be found on Section 3.)
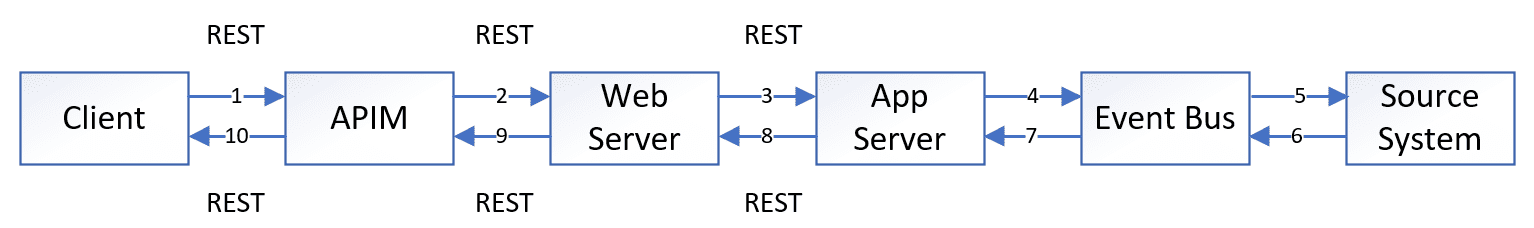
Data Flow:
- Login and Access: The customer initiates a login process on their browser and accesses the customer page.
- Account Inquiry Request: The customer sends a REST request to inquire about their account information. This request goes through the API Management (APIM) system.
- Web Server Processing: The Web server receives the REST request and forwards it to the Application Server.
- Message Conversion: The Application Server converts the REST request into a message and transmits it to the backend account management system via the event bus.
- Account Information Retrieval: The backend account management system processes the request and retrieves the corresponding account balance.
- Response Delivery: The resulting account balance is then sent back to the mobile client through the same path.
Shortcomings of Today’s APM Solutions
Application performance monitoring (APM) tools rely on collecting metrics from logs and the operating system (OS) to monitor individual applications and systems. They offer visualized dashboards for operators and developers to track performance. However, these tools primarily focus on individual components and lack the ability to map the entire data flow within a system.
To achieve full system observability, Code Injection or instrumentation (either manual instrument or auto instrument) is necessary. This involves adding code to system components that emit traces, metrics, and logs. This allows for more comprehensive monitoring and analysis of data flows, but traditional APM tools struggle to connect these traces to the corresponding log files.
Application Log Analysis
Applications generate logs that are typically stored in event logs or log files as needed. APM tools use specific agents to collect these logs, allowing developers to correlate relevant log records and visualize data analysis.
However, log information is often dependent on upstream system data and application logic leading to inconsistency in the keys used across different endpoints. Moreover, log formats may not be consistent across different systems, resulting in different field names for the same type of information. This inconsistency makes tracing Event-Driven Architecture (EDA) flows more complex than Request-Driven Architecture (RDA) flows, as responses do not directly return to the requester.
Further complicating the issue is the common practice of deploying APM tools on-premise, preventing direct client log information upload to the APM framework. As a consequence, troubleshooting cannot solely rely on accurate data, potentially hindering the effectiveness of issue resolution.
In the diagram below, log collection from the client side is not feasible. As a result, we are limited to tracing the web server log using client IP, device information (such as iPhone 13, iPhone 14), and timestamp. To identify corresponding logs from the application server and backend server, we rely on the account number and timestamp. However, when a firewall (FW) or middleware is involved in the data flow, we can only monitor the overall health rather than obtaining detailed message-level tracing.
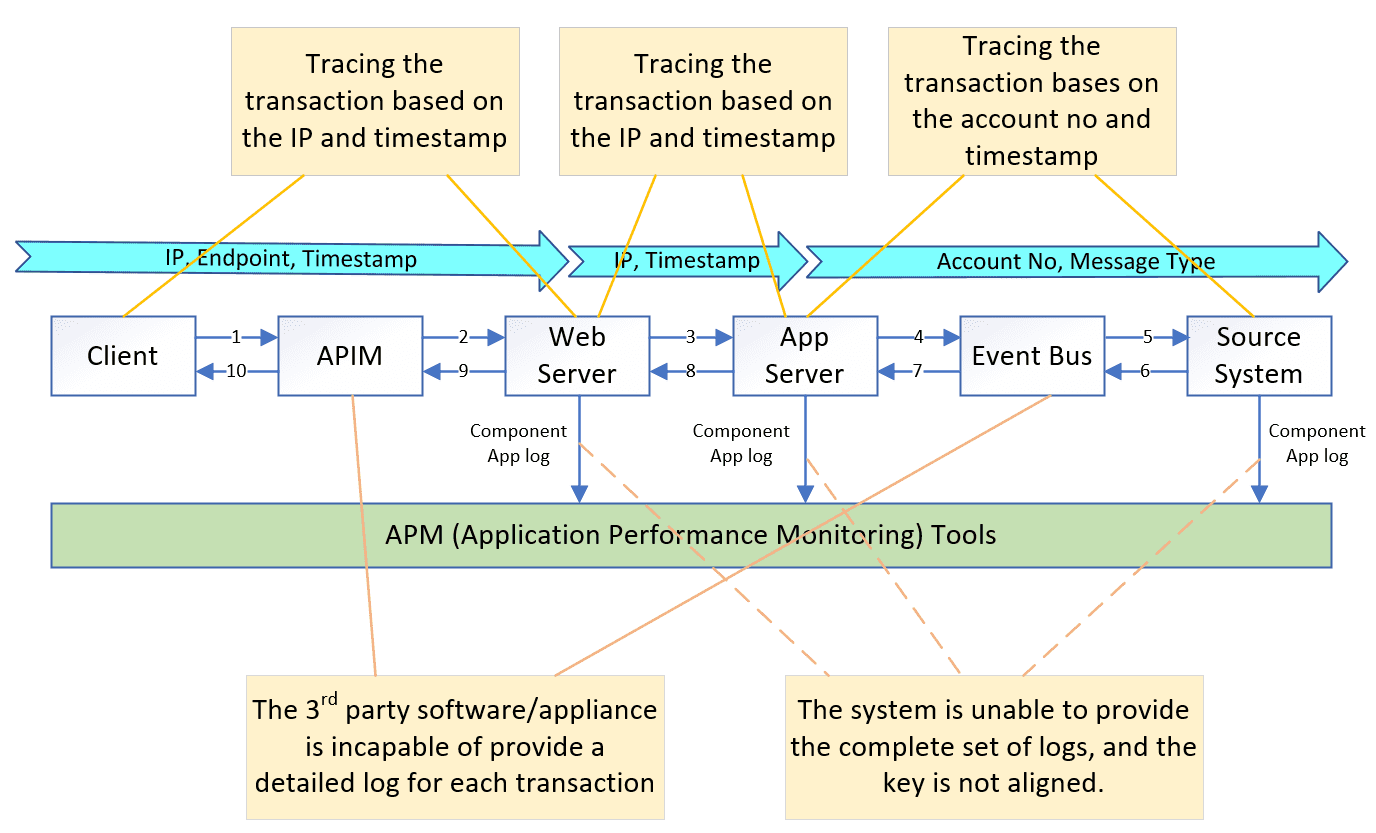
Limitations of the tracing approach that relies on coding changes are quite evident:
- Additional logic needs to be added to the application code to write the necessary information to the log, which can impact application performance.
- The approach does not support tracing through middleware components, limiting visibility into the entire data flow.
- Log formats and content may vary across different systems, making it challenging to have consistent and standardized log analysis.
- There is a risk of vendor lock-in, as implementing tracing through coding changes may bind the application tightly to a specific APM tool or vendor, limiting flexibility and future options.
These shortcomings emphasize the need for a more effective and comprehensive solution for distributed tracing that overcomes these limitations and provides a more reliable and scalable approach.
Code Injection / Instrumentation
APM agents actively monitor application framework, such as .Net or JavaVM, and dynamically capture transaction metrics at various functions. They enrich transmitted messages with tracing information, like a Trace ID, at trigger points, ensuring propagation across the entire data flow. This approach has been proven to be more effective than relying solely on log file analysis. APM Tools like AppDynamics and Dynatrace demonstrate this effectiveness.
However, some APM tools face limitation in tracing specific issues due to:
- Trace sampling: Incomplete data can hinder accurate problem identification.
- Tool coverage: Incomplete instrumentation can terminate tracing abruptly.
- Log correlation: Connecting internal Trace ID to application logs for root cause analysis is challenging, especially with middleware like high-performance API gateways and event buses.
Event-Driven Architecture
Event-driven architecture and event-driven integration enable advantages including faster innovation, built-in message buffering, easy error handling and the ability to disseminate information around the world. Many of these advantages are the result of decoupling, which does have one drawback: when a publisher sends an event to the broker, it doesn’t know where it goes from there. The event broker handles the distribution of events to consumers – whether it’s one, 400, or zero – and the broker doesn’t know what those consumers do with it, either.
You can write logs to Apache Log4j or Elasticsearch, but that doesn’t meet the real-time demands of EDA, and tracing an event through hundreds of potential consumers with standard tooling is not practical.
Solace’s Jesse Menning explains all this in his blog post Why Your Event Broker Needs OpenTelemetry for Asynchronous Communication. so if you’re interested in learning more, I suggest you also read that.
Summary
Both application log analysis and code-injected APM tools require a dedicated agent on the target server. Using multiple types of agents, especially those with code injection can lead to program instability and crashes. This renders them unsuitable for dynamic environments like Kubernetes (K8S) and vendor solutions like API Management (APIM) platforms. Furthermore, their requirement client-side SDK library can cause crashes on memory-constrained mobile apps.
OpenTelemetry
OpenTelemetry (OTel) is an Observability framework and toolkit designed to create and manage telemetry data such as traces, metrics, and logs. OTel has revolutionized observability by merging OpenTracing (tracing only) and OpenCensus (traces and metrics) into a vendor- and tool-agnostic, single, powerful standard. As the second most active project within Cloud Native Computing Foundation (CNCF), it surpasses all but Kubernetes in its momentum and impact.
OTel offers comprehensive end-to-end tracing encompasses a vast array of frameworks, middleware, and appliances; and surpasses traditional APM solutions. OTel’s unique strength lies in its flexibility: requiring minimal code changes (Manual-Instrumentation) or no code changes (Auto-Instrumentation) to be easily enabled within applications.
Recognizing its significance, Gartner has identified OTel as one of the key emerging technologies that optimize technological delivery in 2022. Furthermore, all leading APM tools such as Datadog, Dynatrace, New Relic, Splunk, and Honeycomb [referencing Gartner’s 2023 Magic Quadrant for Application Performance Monitoring and Observability] have announced their support for OTel.
How Does OpenTelemetry Work?
OTel provides an open, industry-standard method for collecting uniform telemetry data across distributed applications, and consists of three key components: Trace, Log, and Metric.
- The Trace component enables the measurement and analysis of time usage for each individual component within a trace flow. This helps in understanding the timing usage of each component within the same data flow.
- The Log component provides detailed information that aids in troubleshooting issues. It captures relevant data and events, allowing for effective debugging and problem resolution.
- The Metric component focuses on measuring the throughput and performance of both the overall system and individual components within specific time periods. It provides valuable insights into system behavior and performance characteristics.
To collect and process these information, OTel leverages the OTel Collector (section 3.1.4), an open-source tool that gathers data from all three components. This collected data is then exposed to the APM framework for further analysis and interpretation.
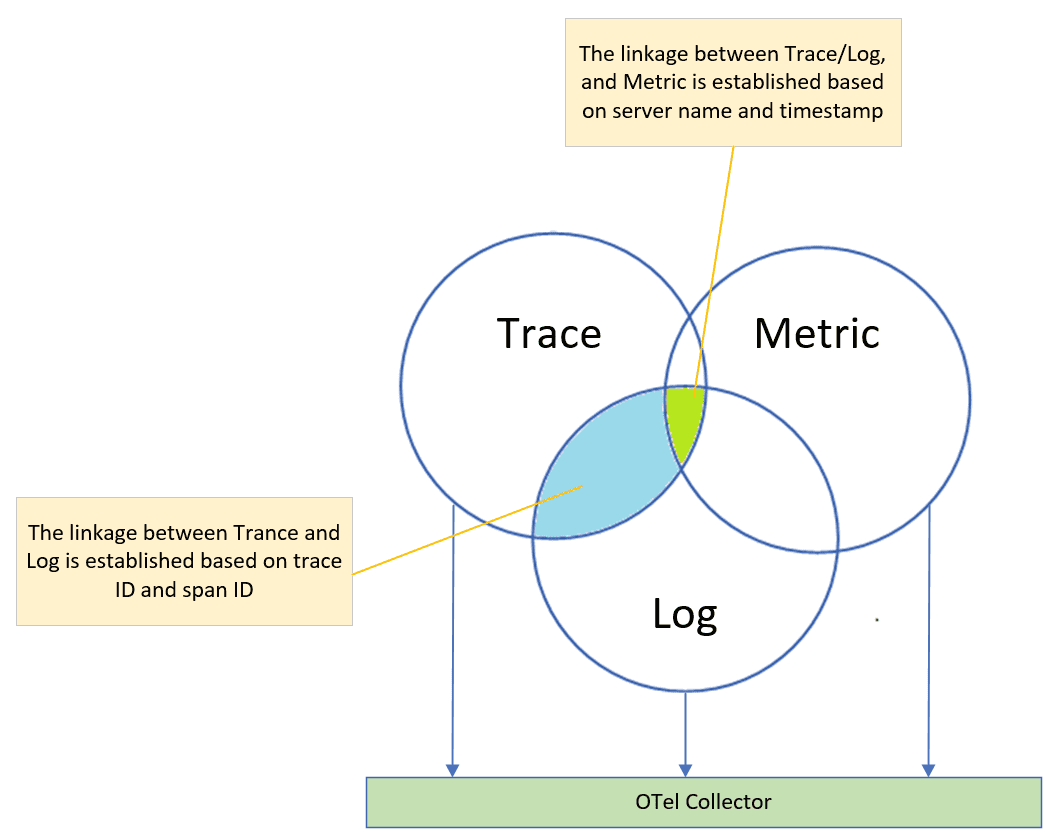
OTel’s Trace component and Log component collaborate seamlessly through unique identifiers like trace ID and span ID. These unique identifiers enable correlation, allowing users to link trace data alongside corresponding log entries for comprehensive analysis and troubleshooting.
In contrast, the Metric component in OTel employs various attributes like server name, timestamp, service name, and port number (for microservices) to capture and analyze performance and throughput of the system and its individual components.
Trace
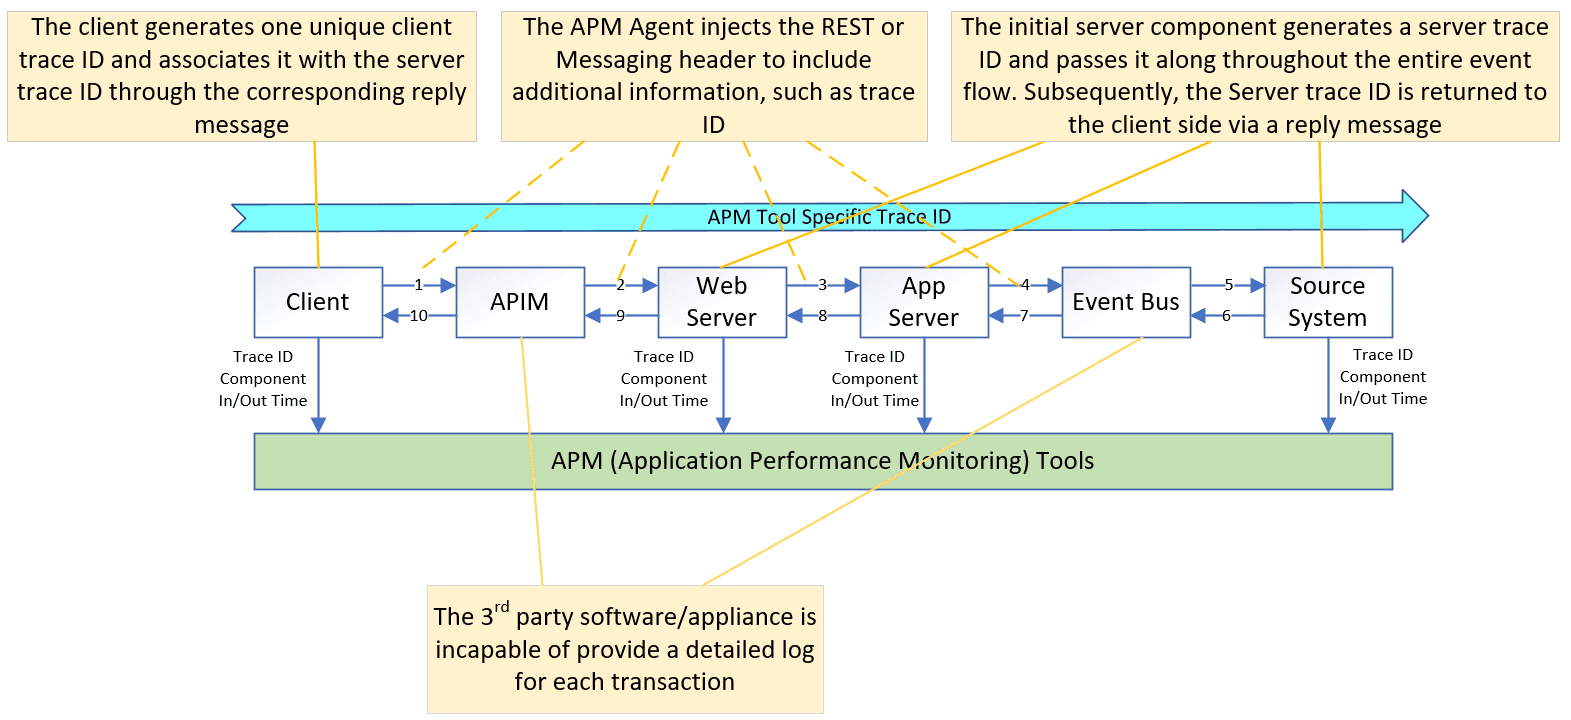
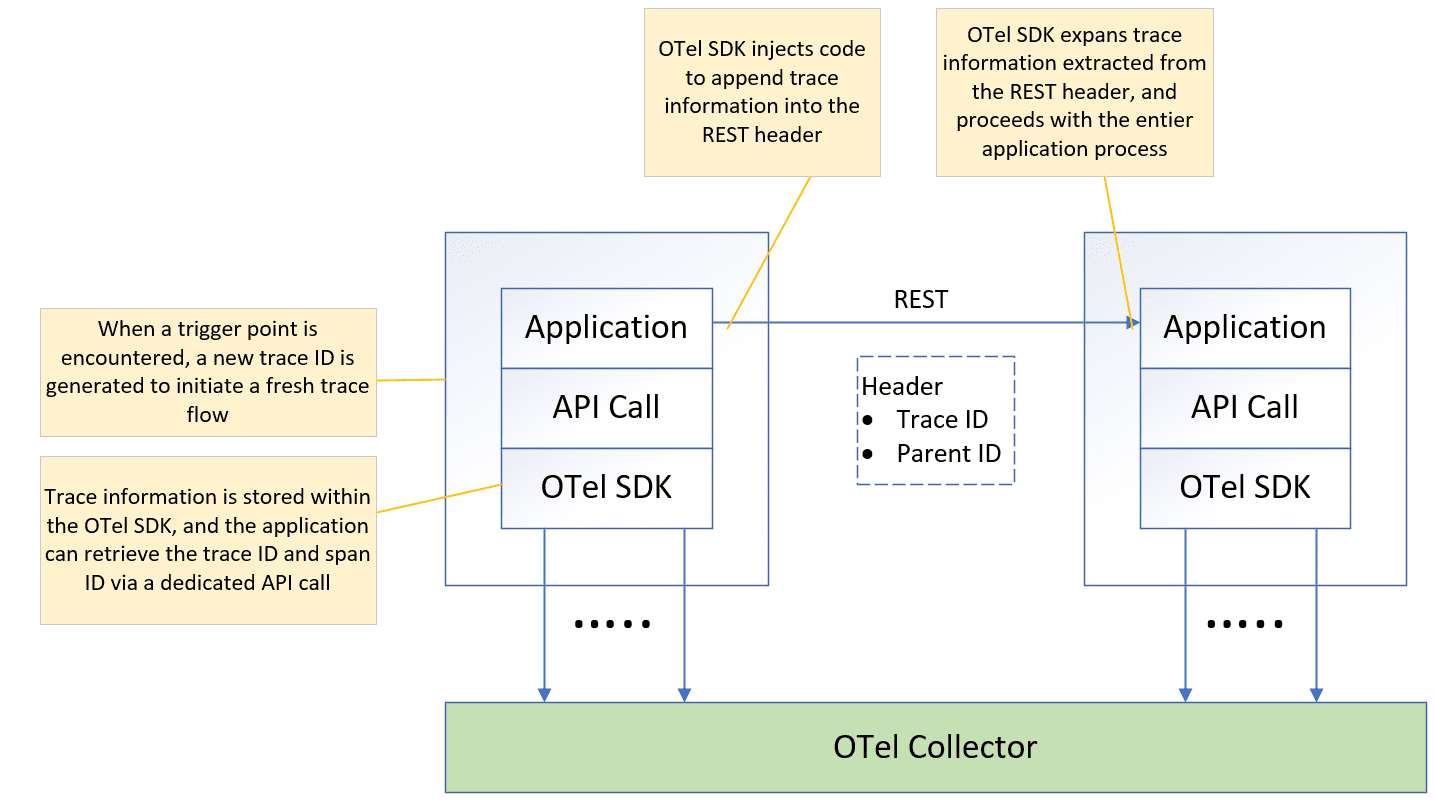
Activating OTel tracing in your application simply requires ensuring it adheres to the OTel SDK or links with the OTel library at start-up. The OTel SDK will automatically capture the incoming and outgoing signals for each API call and trigger the OTel trace log.
Furthermore, the OTel SDK automatically injects code to append the OTel structure to the REST or messaging headers whenever your application sends a message to another application. The receiving OTel SDK will then extract this information from the header, making it accessible throughout the entire application process. This process, known as auto-instrumentation, eliminates the need for any manual code modification in your application.
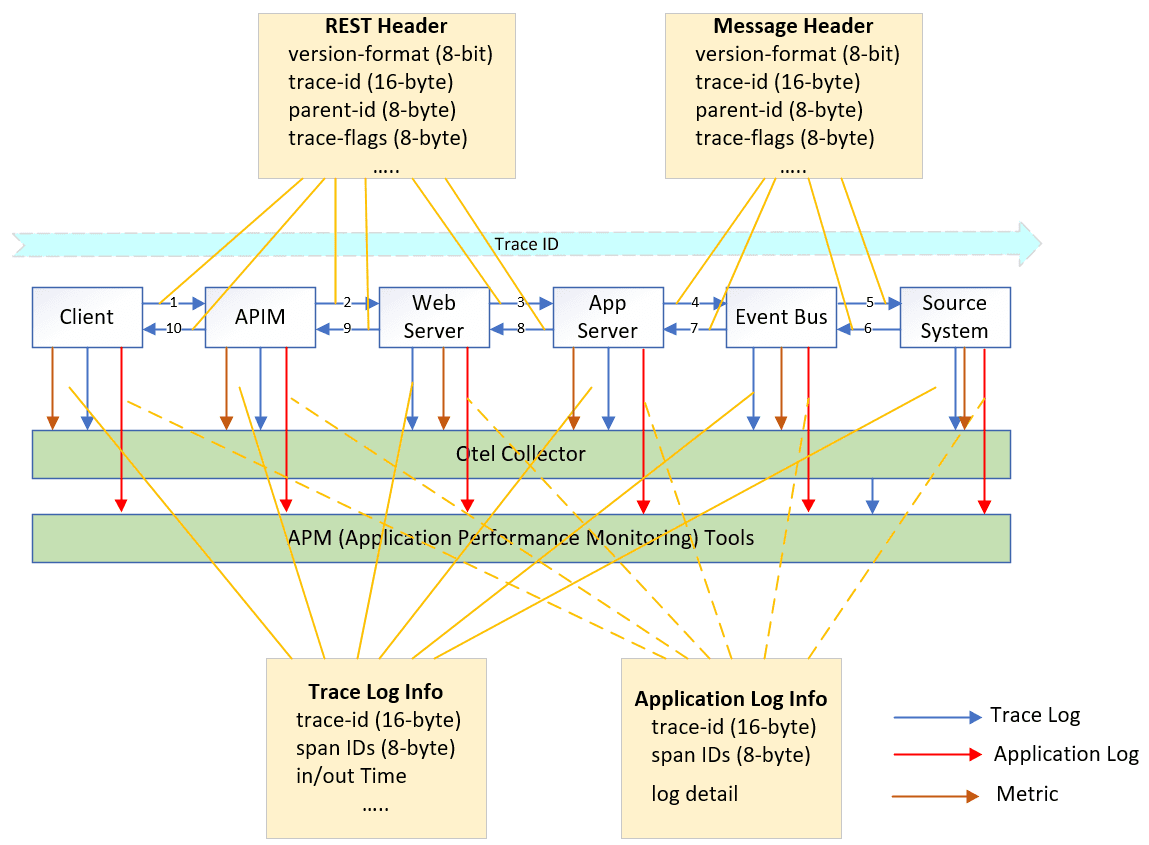
The OTel context is comprised of three key elements: trace ID, span ID, and parent ID.
- trace ID: This unique identifier represents the entire trace flow. It is initially generated at the trigger point and then propagated throughout the entire trace flow.
- span ID: This unique identifier distinguishes each step within the trace flow, acting as a fingerprint for individual steps.
- parent ID: This refers to the span ID of the previous step, establishing the sequential order of each span within the trace flow.
In summary, the trace flow’s trigger point generates the trace ID, which then propagates throughout the entire trace flow. Each step in the trace flow receives a unique span ID, and the parent ID helps connect these steps in the proper order.
The trace ID, a simple numerical identifier, does not have any inherent meaning. To make the trace log more meaningful and informative, we can enrich it with additional business keys. Examples include device ID for user identification or the process function key for specific function tracking. This process is known as manual-instrumentation, and utilizes the OTel API functions to inject business metadata to the trace log.
However, adding these business keys should be done only at the trigger point to avoid bloating the trace log and impacting performance. Unnecessary keys in every span can hinder efficiency.
Additionally, it is crucial to understand the difference between span attributes and baggage. Span attributes allow embedding additional information directly into the trace log, while baggage enables passing additional information across different spans within the same trace flow. The key difference is that the information stored in baggage is not automatically written to the trace log. Therefore, use span attributes when you want extra information incorporated into the trace log, and baggage when data needs to be shared between spans without appearing in the trace log.
When an organization has applications that consists of tens, hundreds, or thousands of services running across many hosts, and sharing messages over one or more event meshes or environments, it is no longer possible to diagnose problems simply by troubleshooting an error message or looking at a log on particular application. In this kind of system, you need a solution that can easily track an event from the sending application, between event brokers, and to the receiving application.
Log
While tracing’s primary purpose is to log timestamps for individual API calls, the auto-instrumentation approach does not capture message payload. This limitation stems from its lack of awareness regarding application logic.
In contrast, manual-instrumentation offers more flexibility, but requires code modification of the application, potentially increasing the size of the trace log and impacting performance.
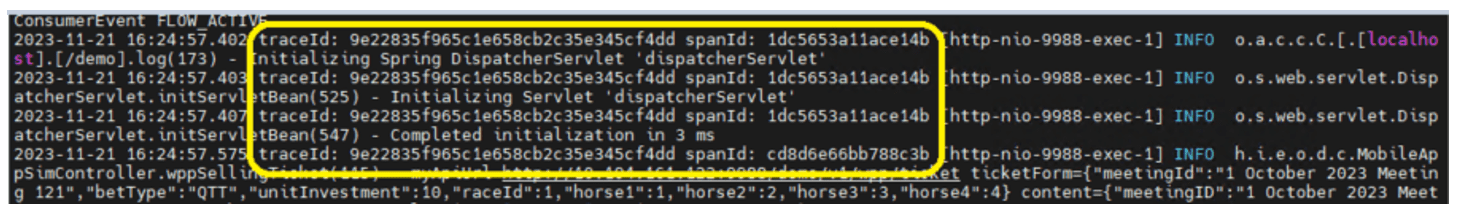
Fortunately, the application log already holds valuable information like thread ID, memory data values, and application steps. OTel provides the flexibility to add the trace ID and span ID to the application log by making configuration changes only. This way, you can link the application log with the corresponding trace without the need for extensive code modifications.
OTel leverages the existing “Log Bridge API” instead of creating a new standard specifically for handling logs. This approach integrates seamlessly with existing logging practices. Collecting and processing logs can be done through the OTel Collector or an APM tool agent. These components gather logs from your application and forwards them to the APM framework.
Upon receiving the logs, the APM tool can link these application logs with the corresponding trace logs using trace ID and span ID. This linkage allows for a comprehensive view of the application’s behavior and performance by combining logs and traces, and delivering valuable insights into the system’s operation.
Metric
OTel defines metrics as measurements of a service captured at runtime. These measurements can encompass various aspects like CPU usage, memory consumption, or service-specific statistics recorded over specific timeframes.
Capturing this metric data requires installing the OTel Collector either directly on the target server or alongside the microservice. This collector acts as the mediator, gathering and forwarding the metric data to the desired destination for processing and analysis.
OTel Collector
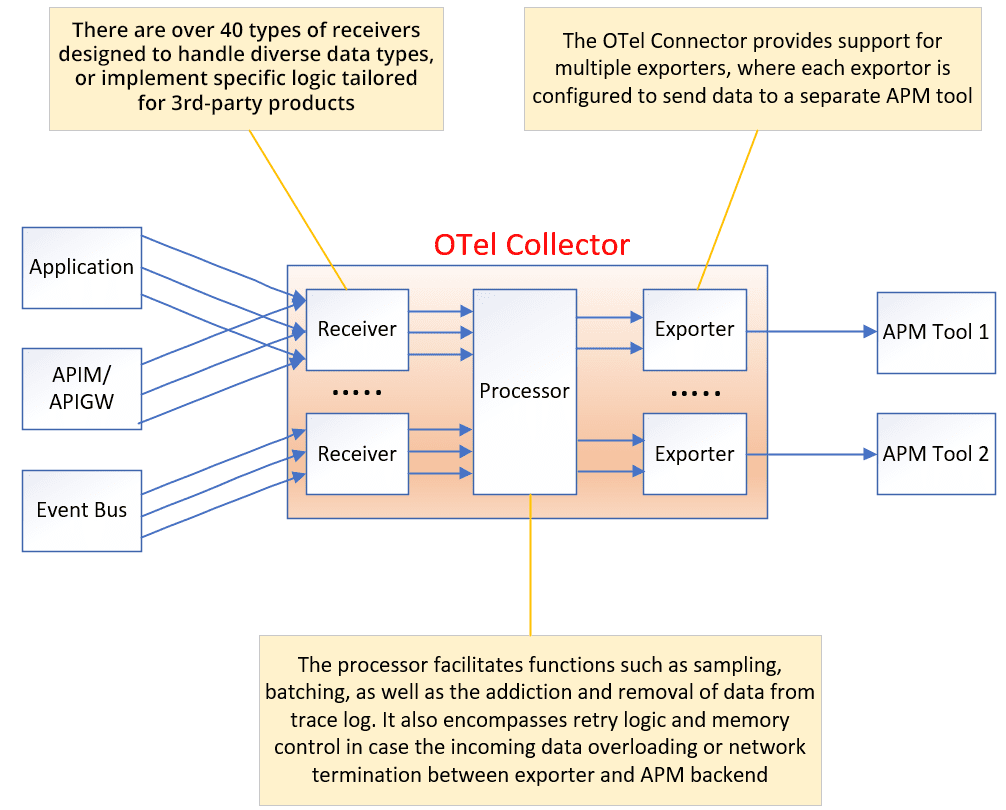
As previously discussed, trace, log, and metric need to be transmitted to the APM framework through the OTel Collector. The OTel Collector is an open-source component that acts as the central hub for gathering, processing, and forwarding observability data.
Many APM products and event bus providers have built plugins for the OTel Collector project on top of the open-source version. These plugins help your chosen backends understand the tracing data associated with messages sent and received by applications or event brokers, enabling end-to-end tracing.
The functionality of the OTel Collector extends beyond routing data and includes important features such as sampling, filtering, and batching:
- Sampling: With OTel, the application does not need to implement any custom logic for data sampling. Instead, it can simply mark the sample flag on the OTel trace structure. The OTel Collector will then filter out data based on a specified percentage (head sampling) or specific criteria (tail sampling), such as error code or latency, when the sample flag is enabled. This sampling functionality helps decrease overall costs and improves efficiency by filtering out normal trace logs and noise.
- Filtering: The OTel Collector provides the capability to filter out trace log content, reducing the size of the trace logs or avoiding exposure of unnecessary data.
- Batching: Batching functionality enables the collector to group logs together and send them to the APM framework in batches. By bundling multiple logs before transmission, the efficiency of the data transfer process can be improved.
By incorporating these sampling, filtering, and batching features, the OTel Collector enhances the overall efficiency and effectiveness of observability data collection. It allows for better control over the data being transmitted, reduces noise and unnecessary information, and optimizes resource utilization to decrease total cost.
The Challenge of OpenTelemetry
OTel has made significant progress with stable releases for both tracing and metrics. Adding trace IDs and span IDs to application logs is straightforward, requiring only a few configuration changes.
However, widespread adoption of OTel in production environments may take another year or two. This delay stems from various factors, including technology coverage and security considerations. As a result, reference cases showcasing the implementation of OTel in large organizations or financial institutions might still be limited.
OTel is still under active development, and there are several factors which can impact its success:
- Technology Coverage: OTel’s current coverage for various technologies and frameworks is still evolving. While it supports many popular languages and platforms, incomplete coverage can hinder its adoption in certain environments.
- Stability and Maturity: As a relatively new technology, OTel needs to establish a strong track record of stability and maturity to gain widespread trust and acceptance. Early adopters might face potential issues related to bugs or limitations in functionality.
- Ease of Integration: Implementing OTel should be straightforward and require minimal effort from developers. Complex integration processes or lack of clear documentation can discourage adoption and slow down its progress.
- Performance Overhead: Adding tracing and log instrumentation can introduce performance overhead to applications. OTel needs to be optimized to minimize its impact on system performance and ensure efficient operation.
OpenTelemetry Coverage is not Enough
The maturity and popularity of OTel will heavily depend on the number of programming languages and protocols it supports.
Programming Language
Programming languages are integral as they generate trace data. Wider programming languages support makes OTel more accessible and applicable to developers across different ecosystems.
Currently, OTel supports 11 programming languages. It is important to note that current coverage may not be sufficient to cater to all popular programming languages, such as C and mobile app development languages like React Native. In such cases, developers might need to rely on vendor-specific libraries or frameworks for tracing and observability capabilities.
The following table lists OTel support for the top 5 most popular programming languages, based on IEEE Spectrum:
| Rank | Programming Language | Trace | Log | Metric |
| 1 | Python | Stable | Experimental | Stable |
| 2 | Java | Stable | Stable | Stable |
| 3 | C++ | Stable | Stable | Stable |
| 4 | C | N/A | N/A | N/A |
| 5 | C# / .Net | Stable | Stable | Stable |
Please note that the level of support for each language may vary, and it is recommended to refer to the official OTel documentation for the most up-to-date information on language support. The OTel community is actively working to expand language support and improve existing integrations.
Protocol
OTel supports a diverse range of protocols for capturing data and enabling comprehensive observability within an application’s ecosystem. Here are some of the key protocols supported:
Mainstream:
- HTTP: This widely used protocol for web communication is essential for tracing requests and responses within applications.
- gRPC: A high-performance remote procedure call (RPC) framework heavily used in microservice architectures. OTel provides tracing capabilities for gRPC communication.
- Kafka: This popular distributed streaming platform allows OTel to efficiently capture and process trace data generated across various services within a system.
- AMQP: Another messaging protocol widely used for inter-process communication. OTel supports tracing for AMQP messages, enabling end-to-end visibility into data flow.
Emerging:
- TCP: This fundamental protocol for network communication allows OTel to capture trace data for TCP-based applications.
- UDP: A connectionless protocol commonly used for real-time applications. OTel provides tracing capabilities for UDP communication to gain insights in performance and behavior.
- WebSocket: This bi-directional communication protocol used in web applications is also supported by OTel for trace data collection.
It is true that many legacy systems still directly use TCP/IP and UDP on the server side, while REST is widely used for communication between clients and servers. In the IoT environment, MQTT has gained popularity as a lightweight open protocol, while AMQP is a full-function open protocol commonly used in data centers.
However, when it comes to protocol support, OTel currently has limitations. While it does support REST and AMQP, as well as some proprietary protocols like Solace’s SMF (Solace Message Format) through specific SDKs or libraries, there are gaps in terms of protocol coverage.
OTel’s protocol support is evolving, and the community is actively working with the corresponding protocol community to expand the range of supported protocols. As the project continues to mature, it is expected that support for additional protocols will be added in the future. This will enable OTel to cater to a wider variety of systems and communication patterns, including those using TCP/IP, UDP, MQTT, and other protocols commonly used in various environments.
Third party software support
Even though an increasing number of vendors have announced their support for OTel, it is important to note that most of them only offer support for tracing. Therefore, you may still need to monitor logs or collect metric data through traditional APM-specific agents and then link them with OpenTelemetry using traditional methods. Furthermore, the coverage provided by these vendors may not be sufficient to support complete end-to-end tracing.
The following table lists OTel support for some popular message bus and APIM products:
| Product | Tracing | Log | Metric |
| Kafka | Yes | No | Yes |
| RabbitMQ | Yes | No | Yes |
| Solace | Yes | No | No |
| Kong | Yes | No | No |
| WSO2 | Yes | No | No |
Please note that this table only provides a limited representation of OTel support, and you can find a more comprehensive list of supported vendor products on the official OpenTelemetry website.
Enabling tracing comes with certain trade-offs, and it is important to recognize that it is not a free solution. When you enable tracing in a system, it can result in a degradation of performance by at least 10%. Therefore, finding the right balance between system performance and troubleshooting is crucial. Achieving the right balance between performance and troubleshooting involves making informed decisions based on the specific requirements and constraints of your system.
Security Consideration
The OTel framework facilitates the transmission of trace, log, and metric data to the APM platform through the OTel Collector. Additionally, OTel injects trace information into REST calls by appending it to the REST header. This trace information is not only comprised of the trace ID and span ID, but also includes component details such as throughput, version number, and component name. These additional details play a crucial role in identifying the specific span component during troubleshooting scenarios.
It is important to note that trace information, including the sensitive context it contains, can potentially be exploited by hackers to launch targeted attacks based on vulnerabilities. For instance, an attacker could disable the sample flag on the trace to carry out a Distributed Denial of Service (DDoS) attack.
Managing the client APM token, which is used to send OTel information to the APM SaaS service, is another critical security consideration, especially when it is deployed across hundreds of thousands of mobile clients.
In addition to client APM token management, there are several other security concerns associated with OTel. These concerns can be visualized in the following diagram:
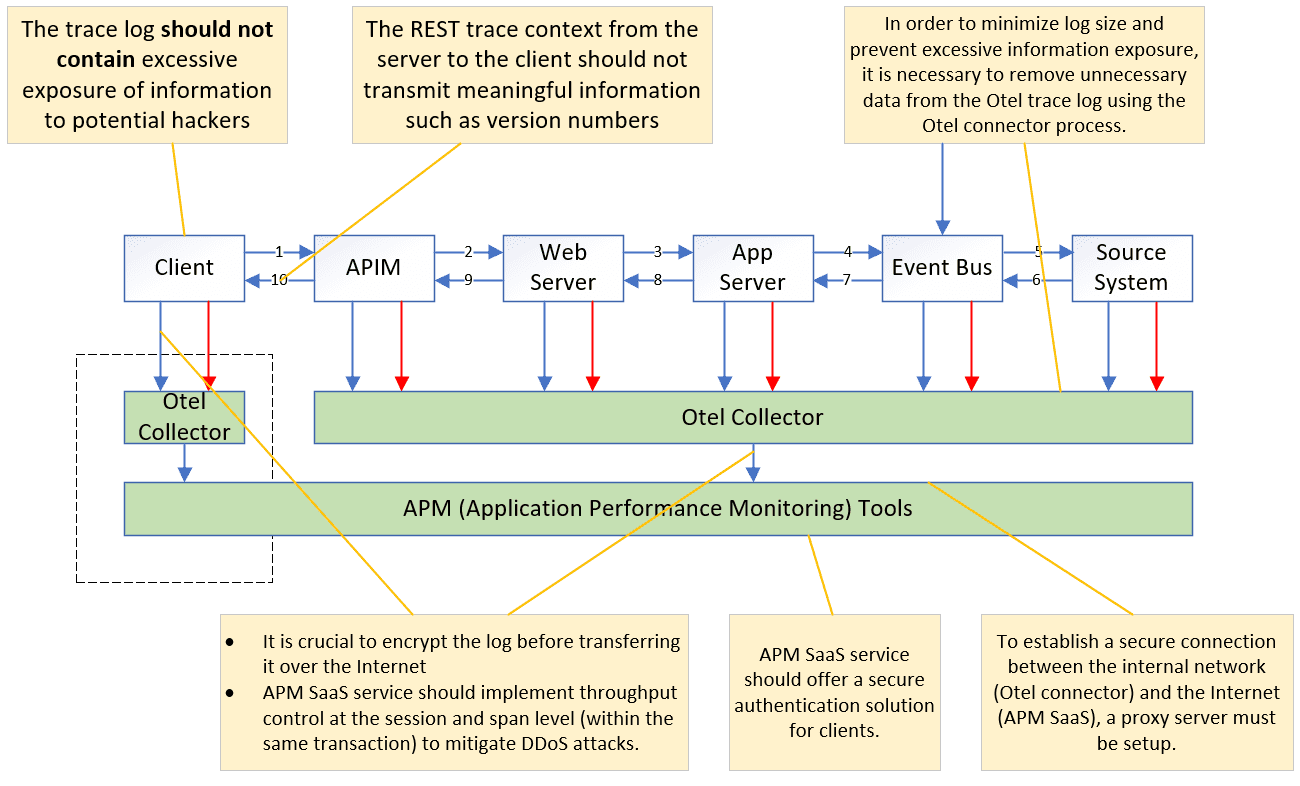
To mitigate such risks, it is crucial to implement robust security control to remove sensitive data, ensuring secure transmission of data and carefully managing the visibility and exposure of sensitive trace information. It is advisable to follow your organization’s best practices for securing your systems to meet security compliance requirements, and regularly update and patch any vulnerabilities that may arise. This can help to protect your systems from potential targeted attacks that exploit sensitive trace information.
Documentation
The OTel official website offers detailed descriptions of the entire methodology, as well as program specifications for various programming languages. Additionally, there are numerous videos and articles available on the Internet that discuss OTel. However, due to the emphasis on promoting the advantages of OTel, it can be more difficult to find resources that address potential limitations, drawbacks, or areas of improvement.
Despite many products announcing support for OTel, their documentation often lacks in-depth implementation details and information regarding performance impact. This can hinder the Proof of Concept (PoC) stage, as integration issues between different products may arise unexpectedly. In some cases, these issues may not have been anticipated or addressed by the vendor’s product team.
How to Build an OTel Solution
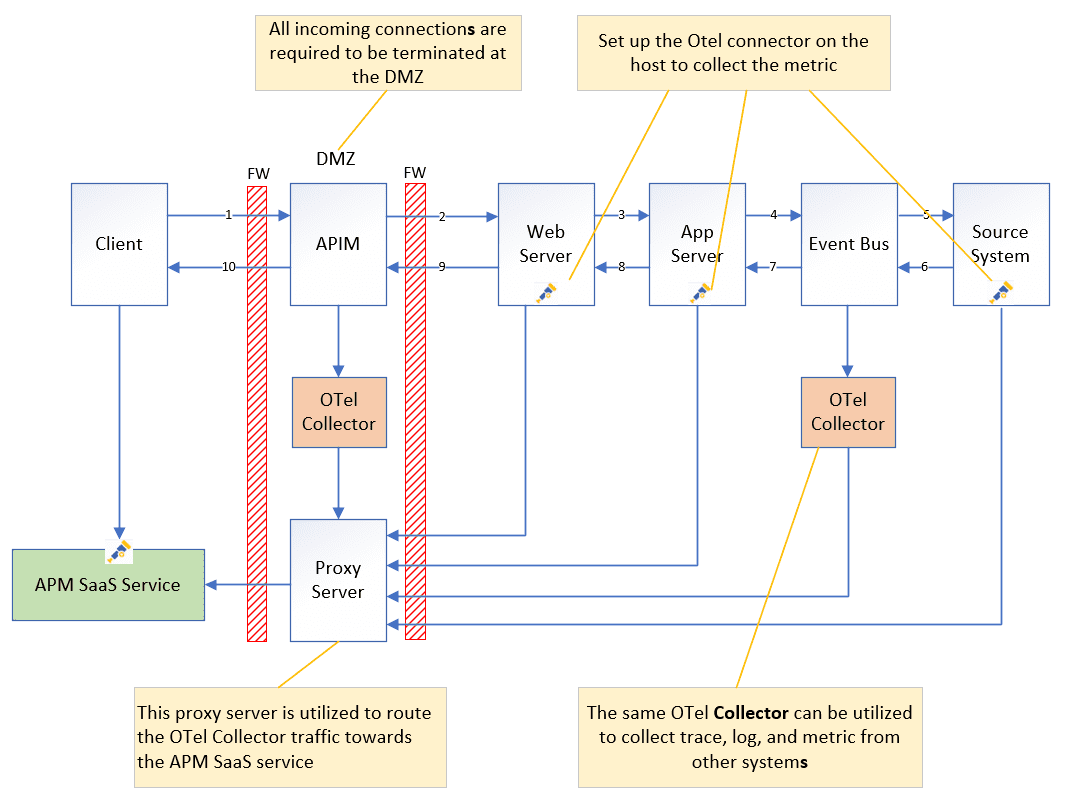
When building a distributed tracing systems, it is recommended for the APM platform to use a SaaS service due to the large amount of traffic from the client side.
On the server side, the OTel Collector is set up to collect Trace, Log and Metric from the target application and process the data before sending it to the APM SaaS via the proxy server on the DMZ.
The previous section explained the basic concepts of OTel; this section provides detailed information that will help you build your first OTel solution.
Step 1: Build a Centralized APM Platform
Establishing a centralized APM platform is an essential initial step, as the OTel data is directly sent to the APM SaaS via REST using batches. The APM built in the OTel Collector will process this data.
Step 2 (optional): Enable OpenTelemetry on Your Event Broker
If your event broker natively supports OpenTelemetry, there are several reasons you should consider enabling it:
- Observability of legacy applications
- Application-independent event tracing, and proof of delivery
- Observability of events across an event mesh
- Bringing service level objectives to an event-driven system
- Monitoring key performance indicators
If you are using a Solace broker, it’s pretty straightforward as explained in their documentation: You create a telemetry profile for the Message VPN, then create a client user and and bind it to the client profile and ACL associated with the telemetry profile, then configure and enable distributed tracing.
If you’re using another broker that supports OpenTelemetry, consult your documentation.
Step 3: Enable OpenTelemetry on Your Application (JMS)
For OTel support via a 3rd party software package or middleware, you just need to enable trace via configuration.
For in-house developed software, the application needs to be compiled with the OTel SDK and linked to the libraries when it starts up. If the application needs to integrate with other middleware, e.g. event bus, it also needs to be compiled with the corresponding SDK.
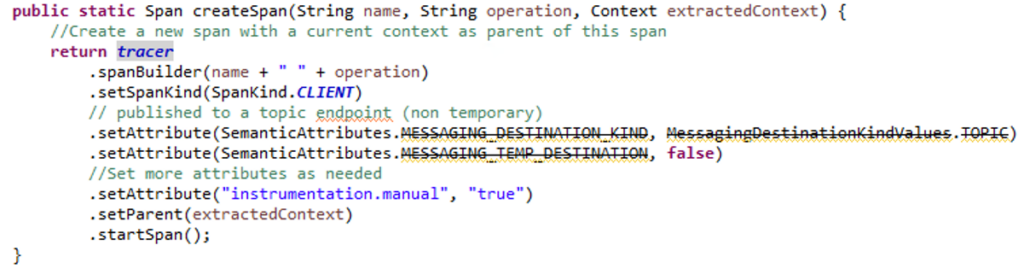
The trigger point needs to add the business key, which can identify the customer or process into the trace via Manual-Instrumentation. The necessary field should be added to the baggage and brought forward to the trace flow.
The following lists the steps to enable Auto-Instrumentation, and Manual-Instrumentation.
Enable Auto-Instrumentation on the Application
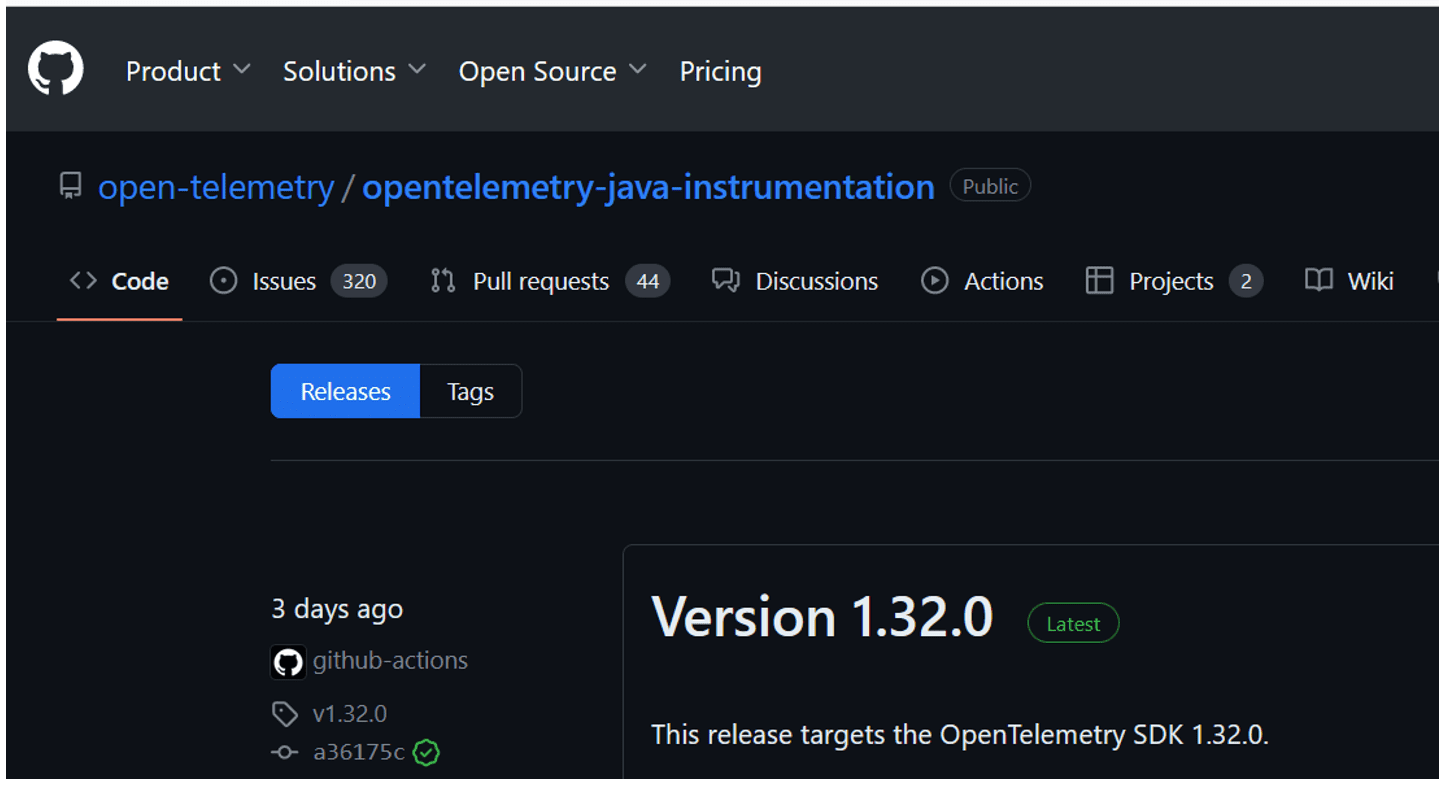
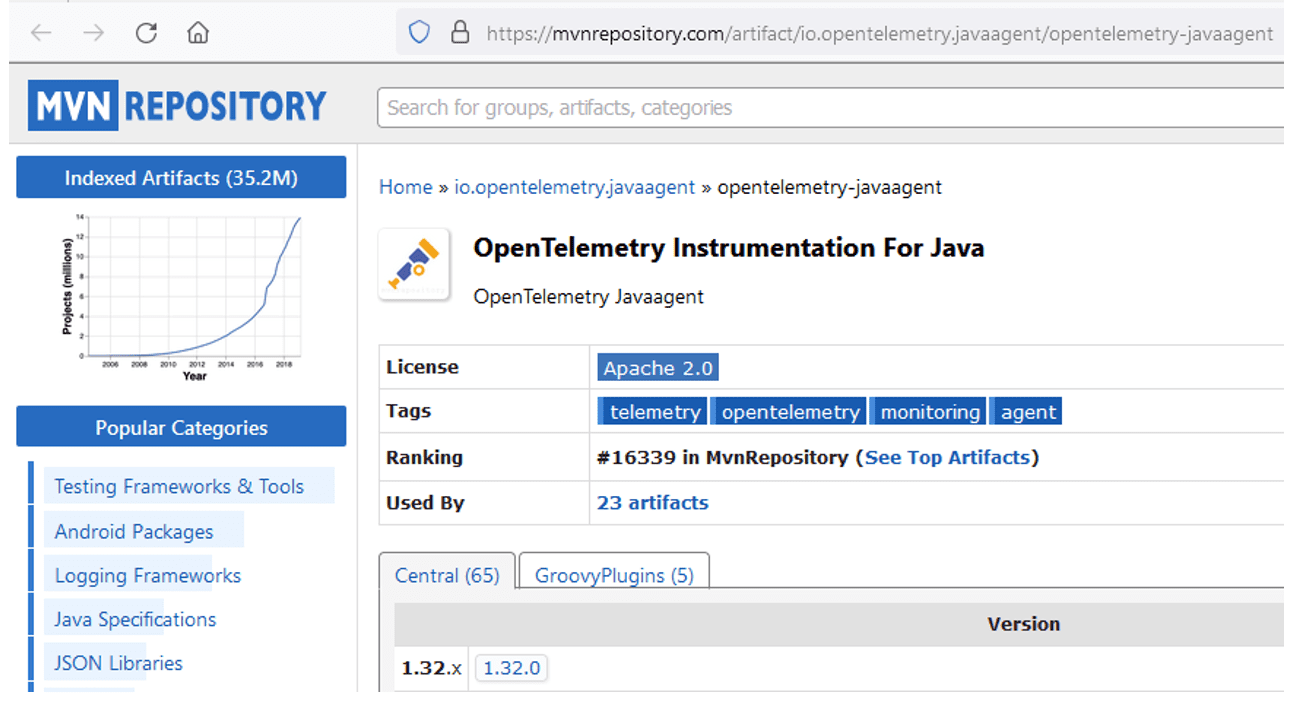
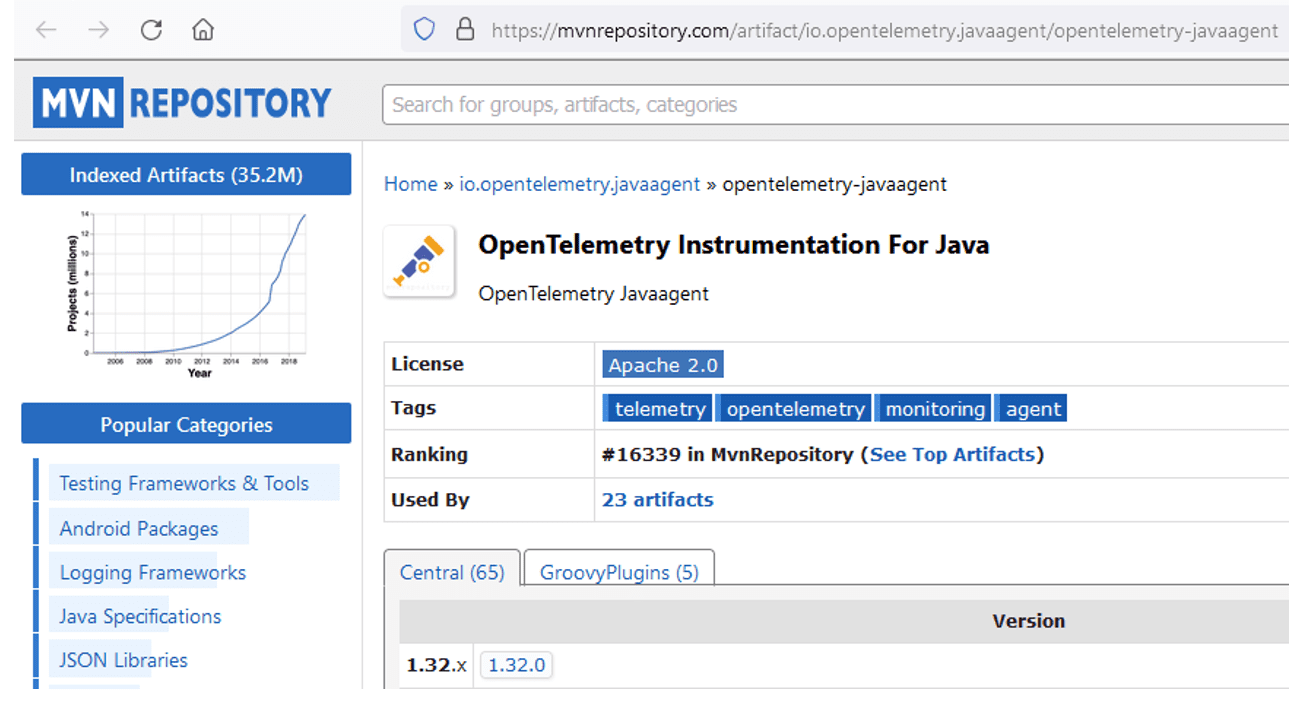
- Download the Open-Source Java Agent through GitHub or Maven repository
https://github.com/open-telemetry/opentelemetry-java-instrumentation/releases/
 https://mvnrepository.com/artifact/io.opentelemetry.javaagent/opentelemetry-javaagent

- (Optional) Download Distributed Tracing Library on 3rd-party product, e.g. Solace
Download the Solace OTel Integration Library for JMS API
(use all the library versions specified by the vendor)
- Add the Java Agent through the JVM Command Arguments
-javaagent:D:/otel/jar/opentelemetry-javaagent-1.29.0.jar - (Optional) Enable distributed tracing on the 3rd-party product
Add the Solace OTel Integration Library
-Dotel.javaagent.extensions=D:/otel/jar/solace-opentelemetry-jms-integration-1.1.0.jar

-Dotel.propagators=solace_jms_tracecontext - Add the corresponding parameters to enable JMS Auto instrumentation
-Dotel.instrumentation.jms.enabled=true - Add the OTel Endpoint configuration
-Dotel.exporter.otlp.endpoint=http://10.194.161.122:4317

-Dotel.traces.exporter=otlp

-Dotel.metrics.exporter=none

-Dotel.resource.attributes="My Application Name" - Configuration completed. Start the service as usual.
Enable Manual-Instrumentation on the Application
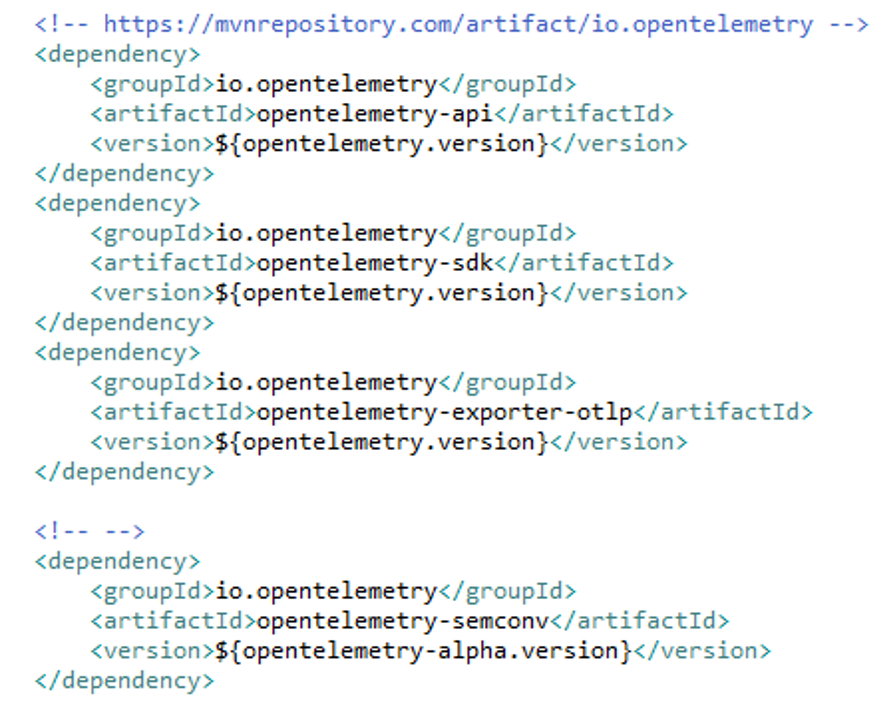
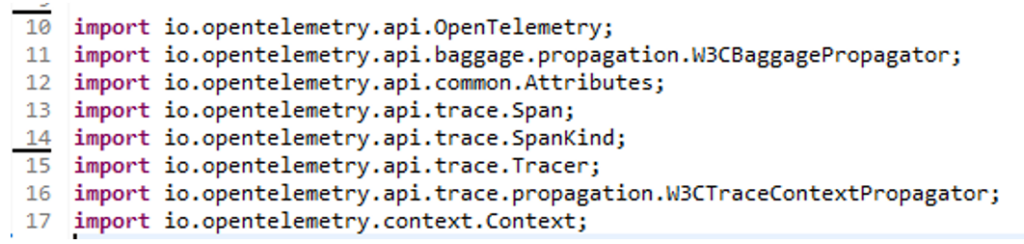
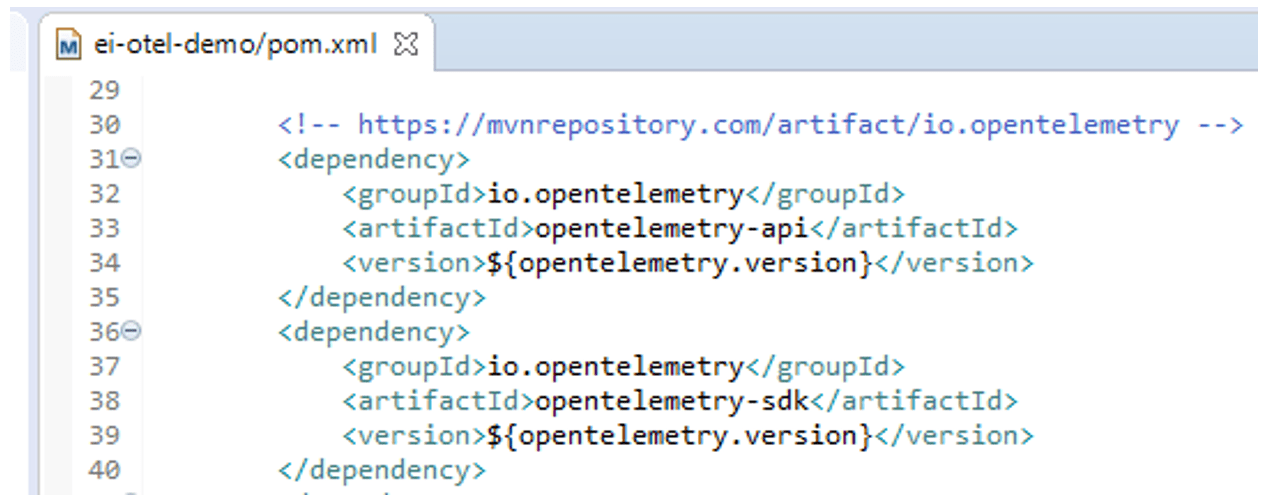
- Install OTel API and SDK dependencies

- Import the corresponding OTel SDK classes and libraries

- Configure manually based on the requirement

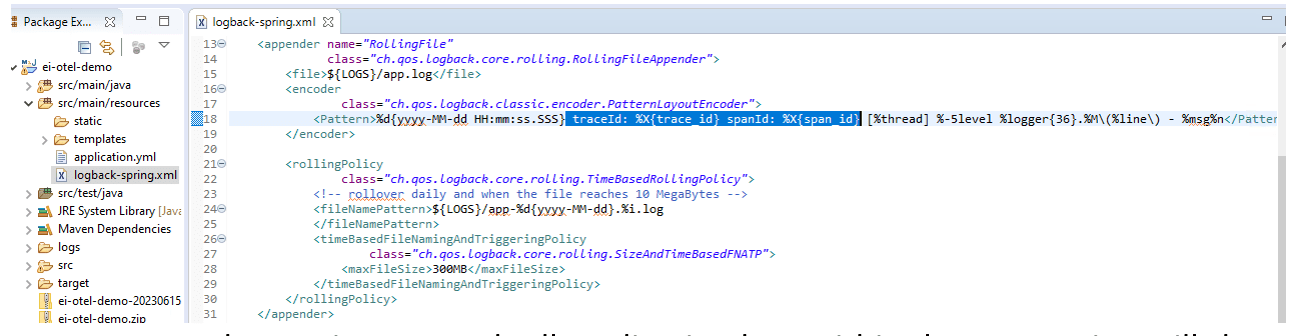
Automatically Append the Trace ID and Span ID on the Application Log
- Add instrumented Log4j2/Logback and OpenTelemetry-API libraries into the project dependencies.

- Update the corresponding XML configuration file to add trace ID and span ID.

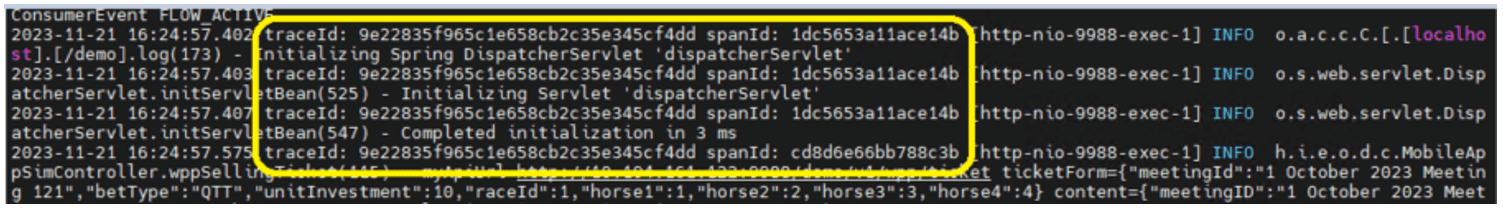
- Start the service as usual. All application logs within the transaction will show information for both IDs.

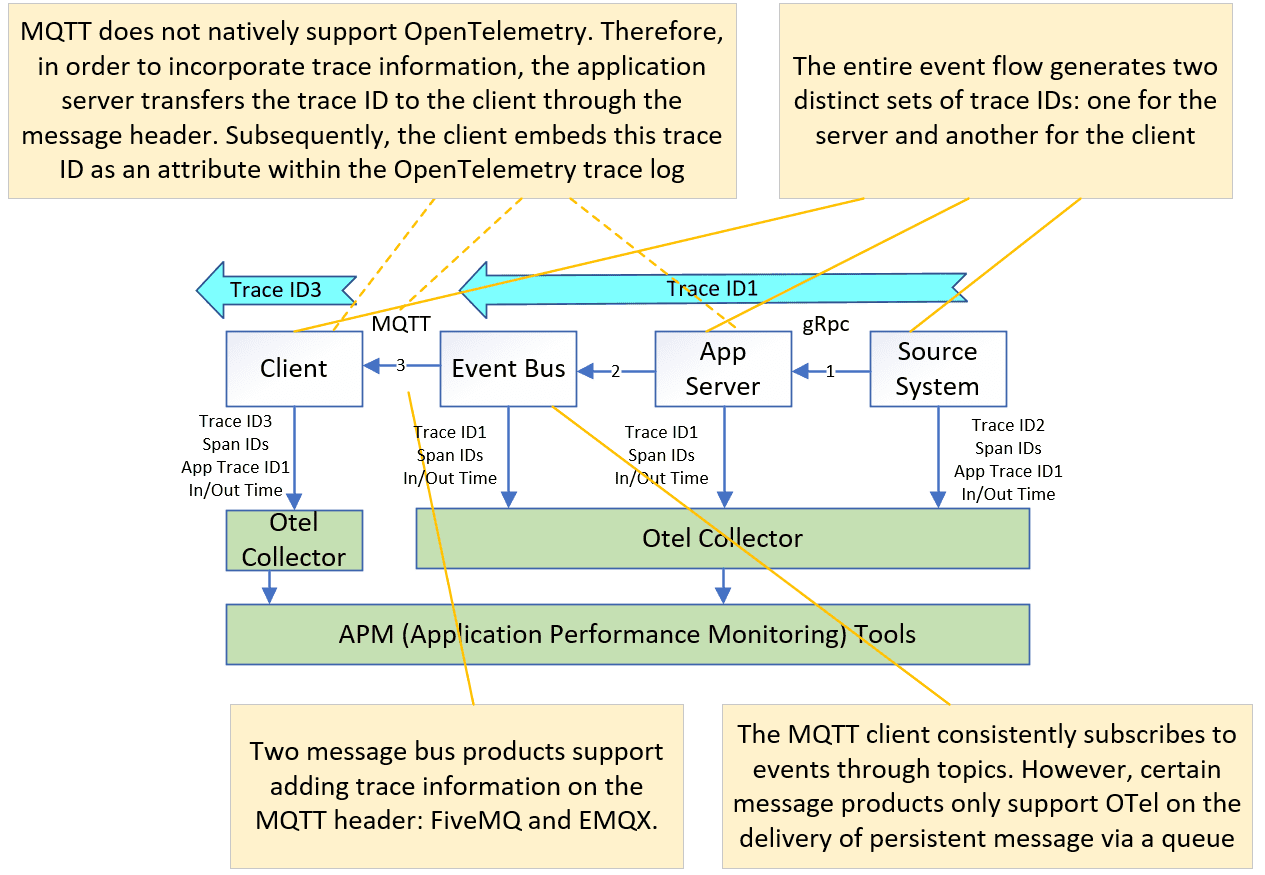
Special Handling for Unsupported Protocols
We need to modify the application code to add trace ID to the message payload or message header. The downstream system exposes the trace ID from the message, and then adds to the span attribute. This case will generate two separated trace IDs, and the APM tool will link them together as a single trace flow. The following diagram is an Information push example, where the publisher adds the trace ID to the message header. The mobile client will retrieve the trace ID from the message header, and add to the new trace span structure.
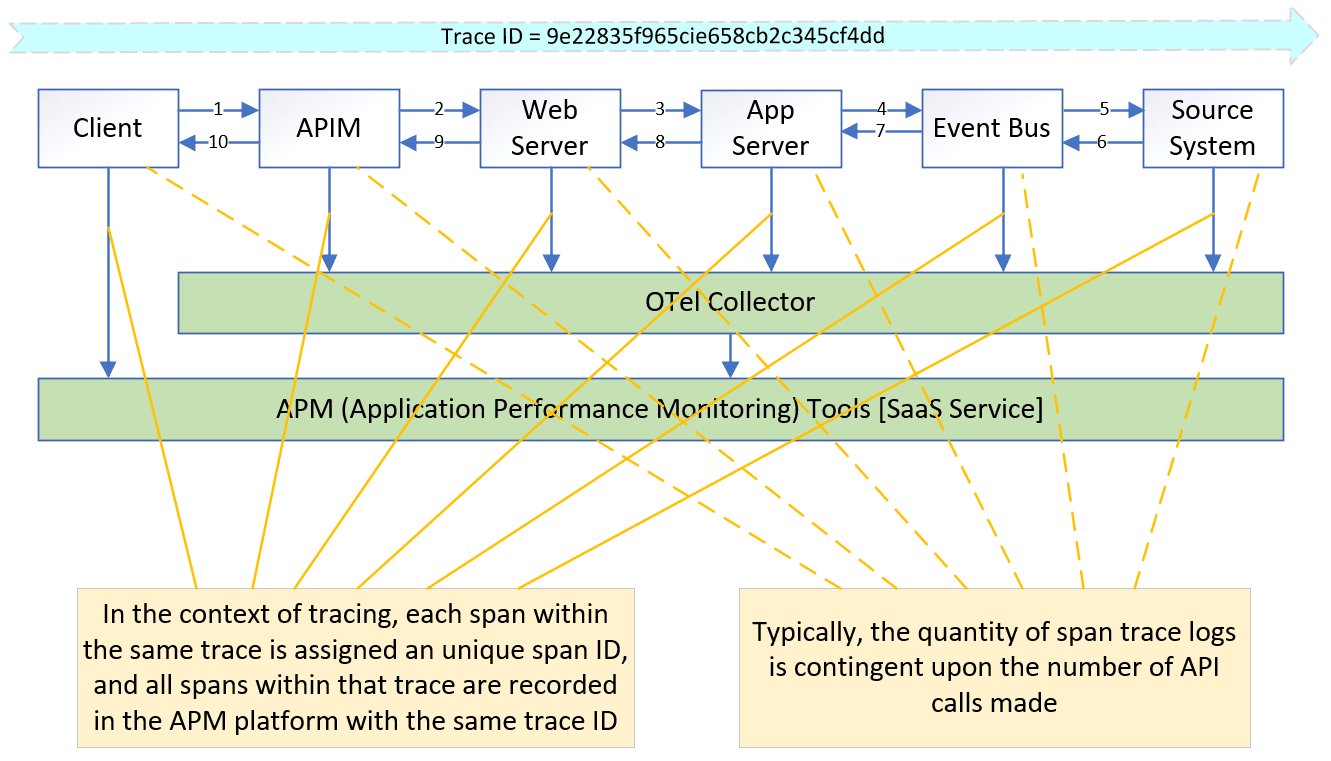
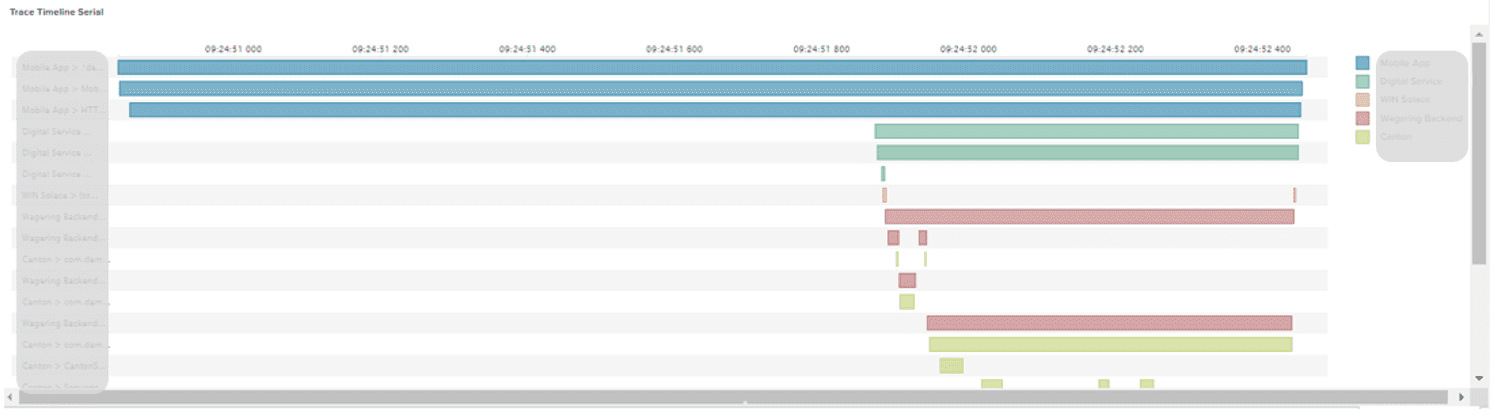
Build the Dashboard on the APM Tool
Whichever APM tool you are using, all of them can link the different spans by trace ID, and display all spans on the dashboard based on the span ID, parent span ID, and timestamp. The individual span also can be linked to the corresponding log and Metric. This can help developers trace the root cause quickly. The following shows a dashboard on Jaeger, and other APM tools have simulate dashboard design
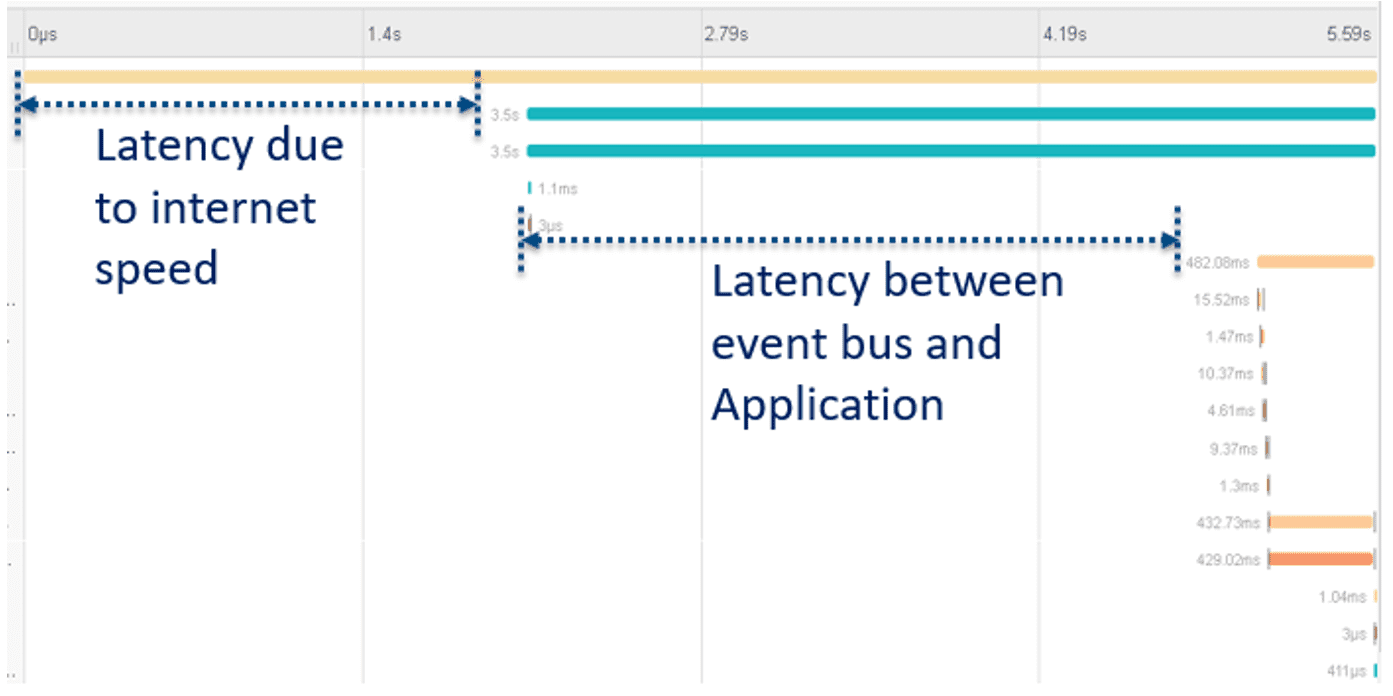
The following diagram shows the case of “Slow Internet” and “High latency between event bus and application”.
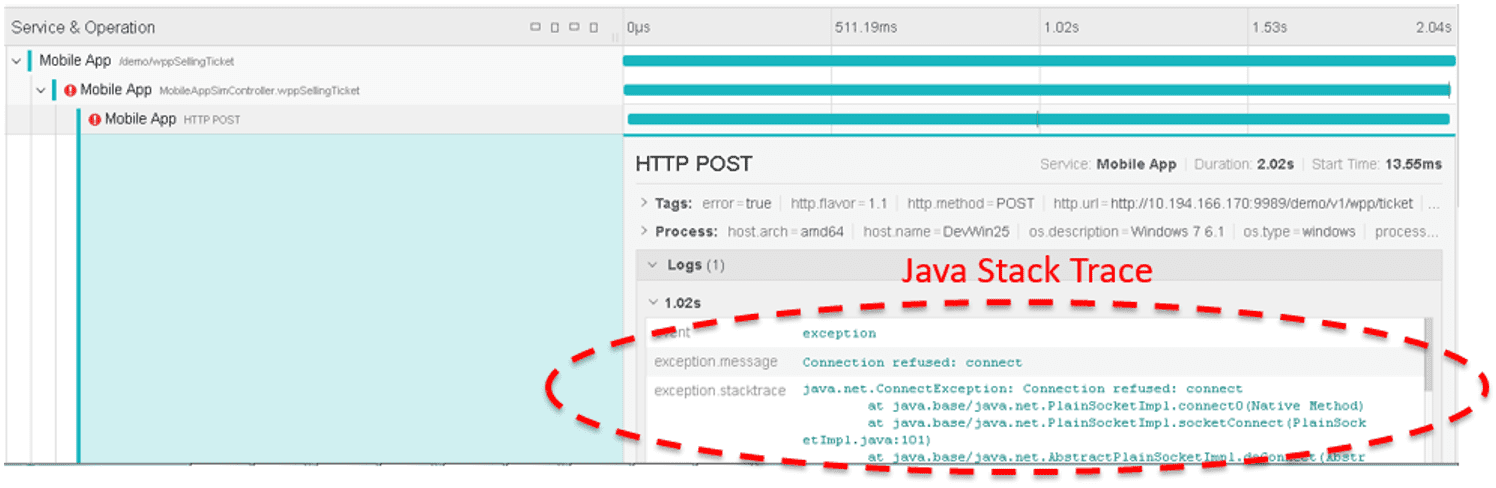
The following diagram shows the case of “Mobile App failed to connect”.
Summary
OTel provides an open standard for automatically collecting telemetry data from applications, frameworks, and third-party products, and exposing it to various APM frameworks. This comprehensive solution enables quick analysis of billions of data points, facilitating efficient troubleshooting within a short period of time.
Undoubtedly, OTel represents a significant technological trend in the logging and monitoring domain. However, it is important to note that this technology is still undergoing further development, and there may be gaps in its widespread production use.
To begin incorporating OTel into your organization, it is advisable to analyze your organization’s specific requirements and select a suitable APM tool as a starting point. Once the APM tool is chosen, you can then enable OTel on a single data flow. Concurrently, it is crucial to provide training for your infrastructure team, architecture team, and development team in parallel, ensuring that they are well-equipped to leverage the benefits of OTel effectively.
Explore other posts from category: For Architects


Subscribe to Our Blog
Get the latest trends, solutions, and insights into the event-driven future every week.