Developing a Disaster Monitoring Service with Solace PubSub+
MakeUofT is Canada’s largest makeathon. Similar to a hackathon, it’s a place where projects come
Daniel Curtis is a member of the Solace Developer Community member. Below he shares his experience creating a POC of a dashboard that displays live streamed data. To watch Daniel demo this application in real time during our Solace Community Lightning Talks, check out his video on YouTube. To participate in the next episode of our Solace Community Lightning Talks, reply to this post in our community.
I was recently tasked with creating a proof of concept dashboard for live streamed data. The idea was to create a dashboard style/layout that is common in business intelligence software such as Qilk Sense or Power BI, but is built using data entirely sourced from a stream. This POC was to demonstrate the power of real-time visual analytics with geospatial data. This project was coded in Python and connects to Solace PubSub+ Event Broker using MQTT, an open standard messaging protocol. The demo data stream used by this application was supplied by Solace, which comprised a real-time stream of data that has a similar taxi mapping display as the dashboard below. This data stream is found on the Solace Marketplace.
To access the data, we must create a subscription to the demo data stream. The events triggered by each received message will allow us to build a Pandas DataFrame in memory that we can use to power our visuals. A DataFrame is loosely like a SQL table or a spreadsheet but stored in memory. The messages sent by the Taxi demo publisher are in JSON format, so we change them into a Python dictionary and then append them to our DataFrame. This will create an ever-extending DataFrame in memory that can be referenced for our visuals later and supports quick calculations for aggregations and filtering. Note that we need the paho-mqtt library added in order to connect to Solace’s MQTT demo data stream. The libraries we’ll also need include Pandas, NumPy, Bokeh, and others. Threading is also recommended to handle the data aggregation outside of the main Bokeh callbacks.
The following code snippet instantiates an MQTT Client to connect to the Solace taxi data publisher:
   sol_client = mqtt.Client()
    #Give our client the user and password
    sol_client.username_pw_set(username=username, password=password)

    sol_client.tls_set(ca_certs=None, certfile=None, keyfile=None, cert_reqs=ssl.CERT_REQUIRED,
        tls_version=ssl.PROTOCOL_TLS, ciphers=None)

    sol_client.on_connect = on_connect
    sol_client.on_message = on_message
    sol_client.connect(url, 8883) #connect to broker
    sol_client.loop_forever()
The following code snippet adds a subscription to the Connect callback to the taxi data topic and creates a system to append data to our DataFrame (js_df). Note that the JSON file in the demo data stream contained nested data, so I had to flatten it to fit it into the DataFrame.
   #Message ran when connection acknowledged from Solace
    def on_connect(client, userdata, flags, rc):
        print("Connected with result code "+ str(rc))

        # Subscribing in on_connect() means that if we lose the connection and
        # reconnect then subscriptions will be renewed.
        client.subscribe("taxinyc/#")
        #client.subscribe("taxinyc/ops/ride/updated/v1/enroute/00000209/#")

    #Runs when we get a message from our Solace subscription
    def on_message(client, userdata, msg):
        #Decode the message sent back to our subscribed application (taxi data json file)
        decoded_record = str(msg.payload.decode('ascii'))
        #Store JSON as python dictionary
        js_dict = json.loads(decoded_record)
        #Flatten it
        js_dict = flatten(js_dict)
        #Turn the flattened dict into a dataframe and append it to the main one
        js_df = pd.DataFrame([js_dict], columns=js_dict.keys())
        df = df.append(js_df)
With our DataFrame now growing with each message, we now have a data source to fuel our dashboard. To build the dashboard I used Bokeh, which is a Python interactive visualization library that has a massive toolkit for plotting and charting data. Bokeh uses a ColumnDataSource class to stream data to their plot objects, which is like the DataFrame we already have created. Each plot object will get its own ColumnDataSource, which is connected to DataFrame columns pertinent to that visual.
It is important to note that Bokeh will update its plots with new data through a periodic callback and not directly with each Solace message, as messages received from Solace are coming in with only a few milliseconds between each message. The DataFrame is immediately appending all data received from Solace, and that DataFrame is referenced every 500 milliseconds to update the visuals, through pushes to the ColumnDataSources referenced by each plot object.
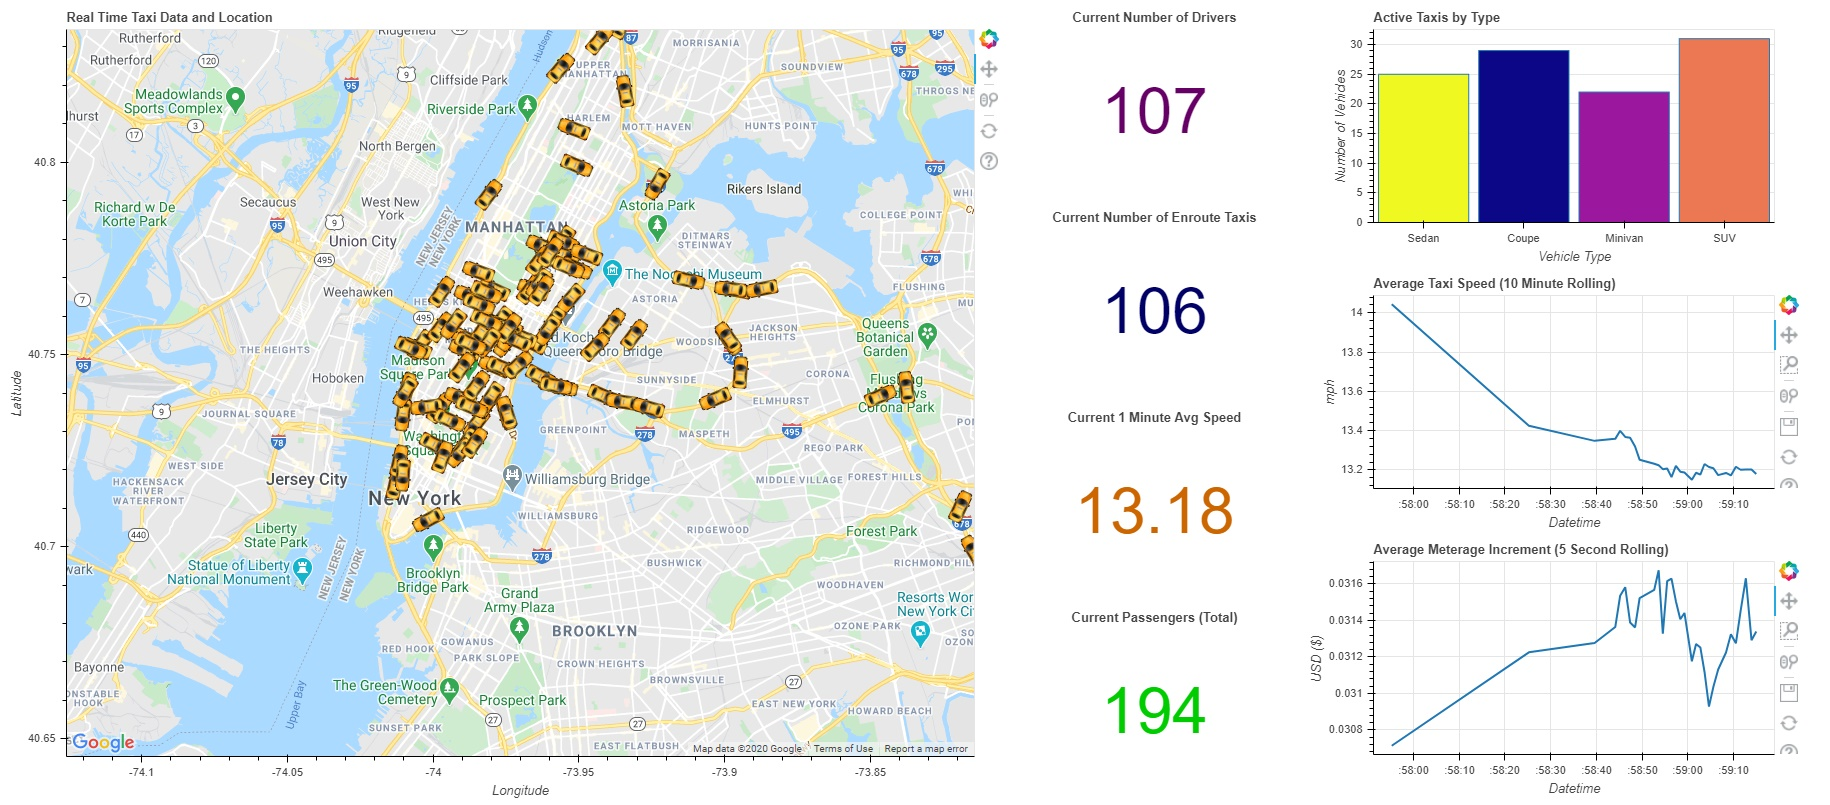
The Bokeh library comes with powerful tools to quickly do some advanced plots. In this dashboard I was able to connect the Google Maps API to Bokeh to create a responsive, interactive map where the taxis are located, with their locations being updated in real time. The taxi data being sent from Solace is immediately added to the DataFrame, which allows for instantaneous plotting of their live location, heading, speed, and other attributes found in the payload schema, all overlaid on a responsive Google map.
The following code snippet creates a Google Map plot where our taxi data is sourced from (roughly the Manhattan area).
# configuring the Google map
lat = 40.74
lng = -73.97
map_type = "roadmap"
zoom = 12
google_map_options = GMapOptions(lat = lat,
                                 lng = lng,
                                 map_type = map_type,
                                 zoom = zoom)
# generating the Google map
google_map = gmap(google_api_key,
                  google_map_options,
                  title = title,
                  width = 1000,
                  height = 800)
google_map.yaxis[0].axis_label = 'Latitude'
google_map.xaxis[0].axis_label = 'Longitude'
The following code snippet instantiates our taxis if they are appearing for the first time on the Google Map plot, otherwise updates their data. This also generates a hovertool for inspecting the taxi data simultaneously. This block is contained within a periodic callback that also updates all of the other plots.
#Group by driver, create streams and plots for each taxi
    grouped_df = df.groupby('driver_driver_id')
    for driver, sub_df in grouped_df:
        if driver in data_source_dict:
            #Get the last row of info in the sub dataframe and covert it to a dictionary with no index
            temp_dict = sub_df.tail(1).to_dict('r')[0]
            #Change all the values to a list format.
            list_dict = {k: [v] for k, v in temp_dict.items()}
            #Stream the new list format values into the data source
            data_source_dict[driver].stream(list_dict, 1)
        else:
            #If driver doesn't exist yet, instantiate a column data source.
            data_source_dict[driver] = ColumnDataSource(data=dict(ride_id=[], information_source=[], angle=[], point_idx=[], latitude=[],longitude=[],heading=[],speed=[],meter_reading=[],meter_increment=[],ride_status=[],passenger_count=[],driver_driver_id=[],driver_first_name=[],driver_last_name=[],
                                                        driver_rating=[],driver_car_class=[],passenger_passenger_id=[],passenger_first_name=[],passenger_last_name=[],passenger_rating=[], transmit_time=[], transmit_minute=[], transmit_second=[]))
            #Instantiate a plot
            taxi_image = ImageURL(url=['mqtt-taxi/static/taxi2.png'], x='longitude', y='latitude', anchor="center", angle='angle', angle_units='deg')
            hover_image = Circle(x='longitude', y='latitude', size=15, fill_color="blue", fill_alpha=0, line_alpha=0)

            image_dict[driver] = google_map.add_glyph(data_source_dict[driver], taxi_image)
            glyph_dict[driver] = google_map.add_glyph(data_source_dict[driver], hover_image)
            hover_tooltips = [("Ride ID", "@ride_id"), ("Info Source", "@information_source"), ("Driver ID", "@driver_driver_id"), ("Latitude", "@latitude"), ("Longitude", "@longitude"), ("Heading", "@heading"), ("Speed", "@speed"),
                    ("Timestamp", "@transmit_time"), ("Meter Reading", "@meter_reading"), ("Ride Status", "@ride_status"), ("Passengers", "@passenger_count"), ("Car Type", "@driver_car_class"),
                    ("Passenger ID", "@passenger_passenger_id")]
            google_map.add_tools(HoverTool(tooltips=hover_tooltips, renderers=[glyph_dict[driver]], toggleable=False))
Once all the plot objects are set up, we can use Bokeh to display them in a row and column style layout quickly with some built-in tools. Bokeh will host this dashboard locally by default, but you can choose to expose it publicly through configs.
The creation of this purely streamed data dashboard was made much easier through the use of Solace PubSub+ Event Broker, as it allowed an easy way to pipe geospatial data directly into memory from a live source, rather than reading from a database. Using Pandas DataFrames and Bokeh makes it possible to create a dashboard featuring real-time location data, along with numerous KPIs and plots featuring derived data from the original taxi data stream. The initial setup and troubleshooting of connecting to Solace PubSub+ Event Broker through MQTT was much easier through reading the documentation Solace had on hand, as well as reading through community posts to understand core concepts for the PubSub+ architecture.
The source code is also available on GitHub as a rough demo.
 Daniel Curtis is a Python Developer/Data Scientist specializing in real-time analytics and machine learning.
Explore other posts from category: For Developers


Subscribe to Our Blog
Get the latest trends, solutions, and insights into the event-driven future every week.