Home > Blog > For Architects
Subscribe to Our Blog
Get the latest trends, solutions, and insights into the event-driven future every week.
Thanks for subscribing.
As a result, everyone who has dealt with microservices will nod in a mixture of recognition, amusement, and pain when reading this tweet:
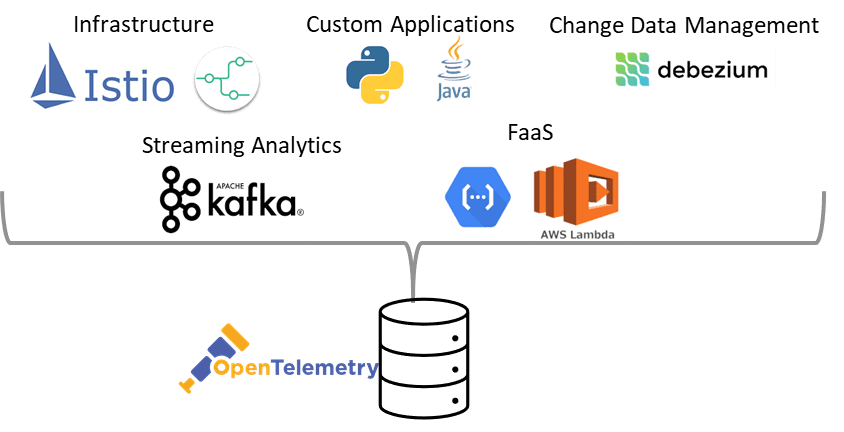
To help people more easily solve the murder mysteries that @honest_update jokes about in their tweet, the open-source standard OpenTelemetry tracks transactions as they move between microservices – sometimes across geographical boundaries – and interact with databases and other technologies.
What is OpenTelemetry?
OpenTelemetry specifies a format for consistent tracking information. Each participant in the business function sends OpenTelemetry information for each transaction to a central database. The OpenTelemetry record always includes basic fields like a transaction ID and timestamp, and can include business-relevant information like an order number or a stock ID.
What is distributed tracing and how does OpenTelemetry work for event-driven integration?Learn how distributed tracing solves issues in the synchronous API world and why it fits even better into event-driven architectureRead Now
When the database is paired with a front end like Jaeger, Zipkin or DataDog, the information becomes searchable, and can be displayed in an intuitive form so you can see how microservices relate to each other and give clues as to why things aren’t working as expected.
OpenTelemetry and Asynchronous Communications
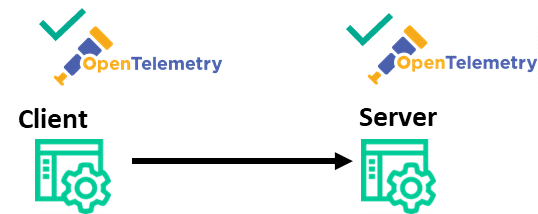
OpenTelemetry has brought observability to plenty of places like microservices, client-side APIs, databases, service mesh, etc., but to this point, OpenTelemetry has focused on synchronous interactions—situations where a client makes a request to a server and waits patiently for a reply.
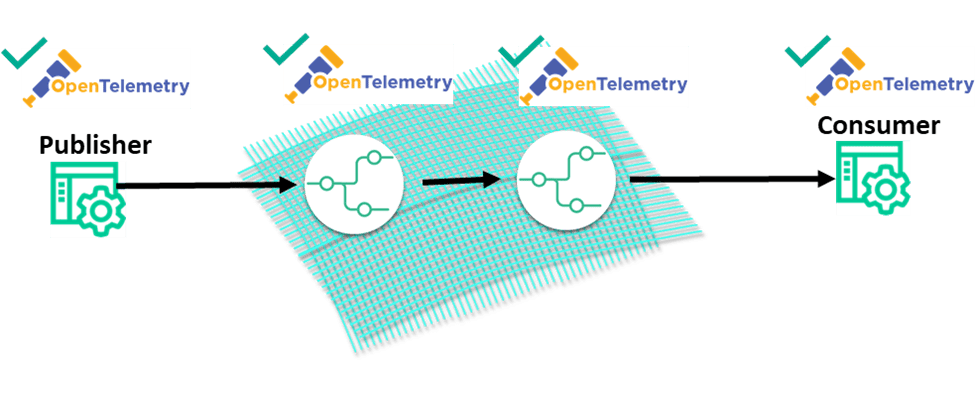
There is much less maturity on the asynchronous side, the land of event brokers and WebSockets, and even less progress in instrumenting event brokers themselves.
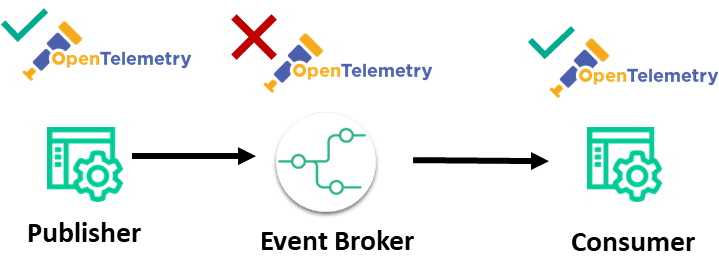
A typical synchronous architecture—the lack of broker support of OpenTelemetry leaves a “black box” in the architecture.
Some benefits of including OpenTelemetry in your event broker are:
- Legacy application observability
- Tracing of events / proof of delivery
- Observability of events within an event mesh
- Bringing to your event-driven architecture
- Monitoring key business KPIs
The OpenTelemetry community has formed a messaging special interest group that’s committed to including event brokers in the specification. As I write this, members from a variety of perspectives are considering what OpenTelemetry means for asynchronous communication, and how event brokers should be included.
The Benefits of Event Broker OpenTelemetry
1. Legacy Application Observability
With potentially hundreds of applications and microservices in your enterprise, retrofitting them all with OpenTelemetry at the same time is impossible. And some applications are beyond your control and might never have built-in OpenTelemetry. For instance, Integration Platform as a Service (iPaaS) solutions like Mule and Boomi, and Software as a Service (SaaS) solutions like Salesforce have limited or proprietary observability options. How do you rope them all into single enterprise view?
An event broker is in an ideal position to help. Event brokers are independent of applications, but at the same time, in an event-driven system all communications between applications flows through event brokers. This “middleman” perspective (similar to that of a service mesh) can add observability into applications that currently don’t have OpenTelemetry capabilities.
With no code changes to applications, you can get crucial auditing and debugging information like:
- all events going into a microservice and their origin
- all events coming out of a microservice and their ultimate destination
- the rate at which a microservice processes events
2. Tracing Events / Proof of Delivery Independent of Applications
The classic event-driven support conundrum can be summarized as: “Where is my event?”
A producer swears that it published the data correctly, the infrastructure team in charge of the event broker swears that everything is configured correctly, the microservice that should have the crucial data swears that it never arrived.
Who do you blame?
The challenge is that producers and consumers often have vastly different techniques and formats for logging events (if they log them at all). And, if there’s not a trusting relationship between the producer and consumer (and let’s face it, sometimes teams don’t get along), this simple question can turn into an argument pretty quickly.
Event brokers can be a neutral third party in these situations. Event brokers with OpenTelemetry can generate a trace to confirm a publisher actually sent the event and when a consumer initially received an event. When the consumer acknowledges it, it no longer needs the event broker to hold onto it.
Traces let you more definitively and independently answer questions like:
- “Was the event published to the event broker in the first place”?
- “Was it delivered to the consumer”?
- “Did the consumer acknowledge receipt”?
Proof of delivery is especially important when you are exposing an event API product and the consumer of the event is a third party.
3. Observability of Events Within an Event Mesh
If you thought things were complex with one event broker, just wait until multiple event brokers start interacting with each other. A network of event brokers is called an event mesh, a layer that complements service mesh and connects not only microservices, but also legacy applications, cloud-native services, devices, and data sources/sinks and these can operate both in cloud and non-cloud environments.
Many believe that this is the future of event-based communication, with multiple brokers in multiple geographic locations, belonging to different enterprises. While event meshes allow you to transparently move information across the globe, it makes understanding the paths of individual events even more important.
4. Bringing Service Level Objectives to Your Event-Driven Architecture
The world of synchronous APIs has long included the ability to set performance requirements for API calls. These performance requirements are often commitments by microservices to process certain numbers of requests per minute or hour, or to respond to a request within a certain time period.
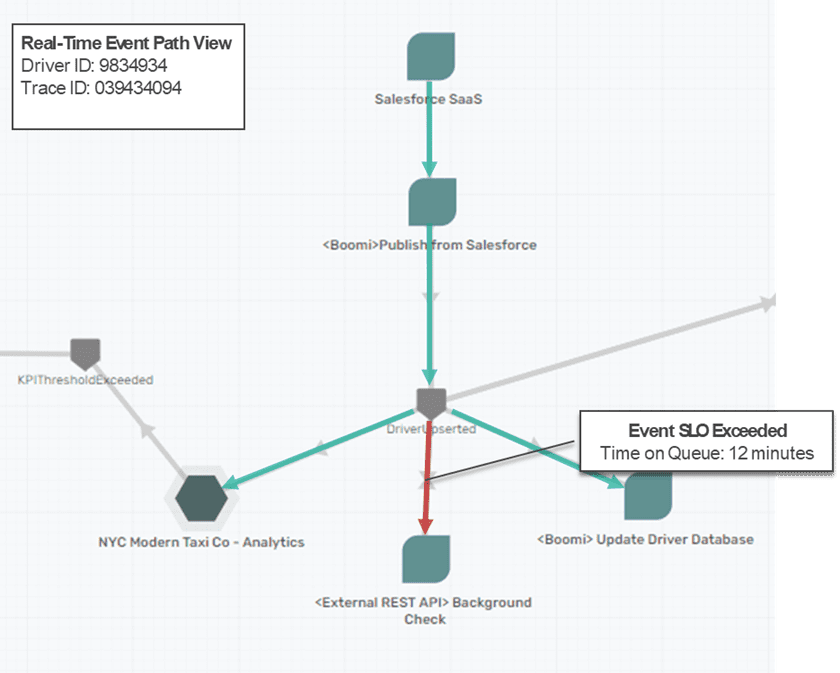
The asynchronous world hasn’t traditionally had the concepts or tooling needed to create service level objectives (SLOs), but the information provided in OpenTelemetry provides the insights needed to establish, alert, and enforce SLOs.
5. Monitoring key business KPIs
Finally, as noted above, OpenTelemetry can include business-relevant information in the trace. Typically, this is used for searching through mountains of to find the transaction you are interested in, but business-related fields can also be aggregated. Given the broker’s middleman perspective, OpenTelemetry data generated by an event broker can be the basis of key performance indicators (KPIs) that stretch across the company.
What’s Next for OpenTelemetry
More widespread adoption of event-driven architecture (and asynchronous communications in general) requires standardized solutions for understanding why things aren’t working properly, or how they could work better. With its widespread industry support, OpenTelemetry is key to making that happen. The next step in OpenTelemetry’s evolution is to include event brokers in a more mature fashion, opening more possibilities for asynchronous communication.
Explore other posts from category: For Architects

As an architect in Solace’s Office of the CTO, Jesse helps organizations of all kinds design integration systems that take advantage of event-driven architecture and microservices to deliver amazing performance, robustness, and scalability. Prior to his tenure with Solace, Jesse was an independent consultant who helped companies design application infrastructure and middleware systems around IBM products like MQ, WebSphere, DataPower Gateway, Application Connect Enterprise and Transformation Extender.
Jesse holds a BA from Hope College and a masters from the University of Michigan, and has achieved certification with both Boomi and Mulesoft technologies. When he’s not designing the fastest, most robust, most scalable enterprise computing systems in the world, Jesse enjoys playing hockey, skiing and swimming.


Subscribe to Our Blog
Get the latest trends, solutions, and insights into the event-driven future every week.
Thanks for subscribing.


