AsyncAPI, CloudEvents, OpenTelemetry: Which Event-Driven Specs Should Your DevOps Include?
A decade ago, event-driven architecture was the wild west. Documentation? It’s in a spreadsheet somewhere.
To manage complex distributed systems, you need to be able to observe and understand what’s happening to all of the components that make up the system, including the flow of information between them. Observability, however, hinges on the assumption that every component can generate information about what’s happening with it, and in an event-driven system that can be quite complicated.
For example, if you have an application that executes activities A, B, and C, and publishes a message to an event broker, which then goes to a queue, you would want to know what happened from start to finish: from the publishing application, to and within the broker, all the way to the receiving application, for every event.
With this blog post I’ll explain two important aspects of observability in the context of event-driven architecture (EDA):
To answer these two questions, we will look into two technologies:
Before diving deep into the distributed tracing of event-driven systems, I’d like to step back and cover some core concepts.
Distributed tracing (DT) is designed to let you observe and understand the journey of information through a distributed system by generating and collecting information about what happens as a piece of information flows through the system. DT falls under the umbrella of tracing, which is in turn one of the three pillars of observability. The goal of observability is to understand what is happening in the system so you can tell what went wrong when something does, or identify bottlenecks and figure out how to fix them.
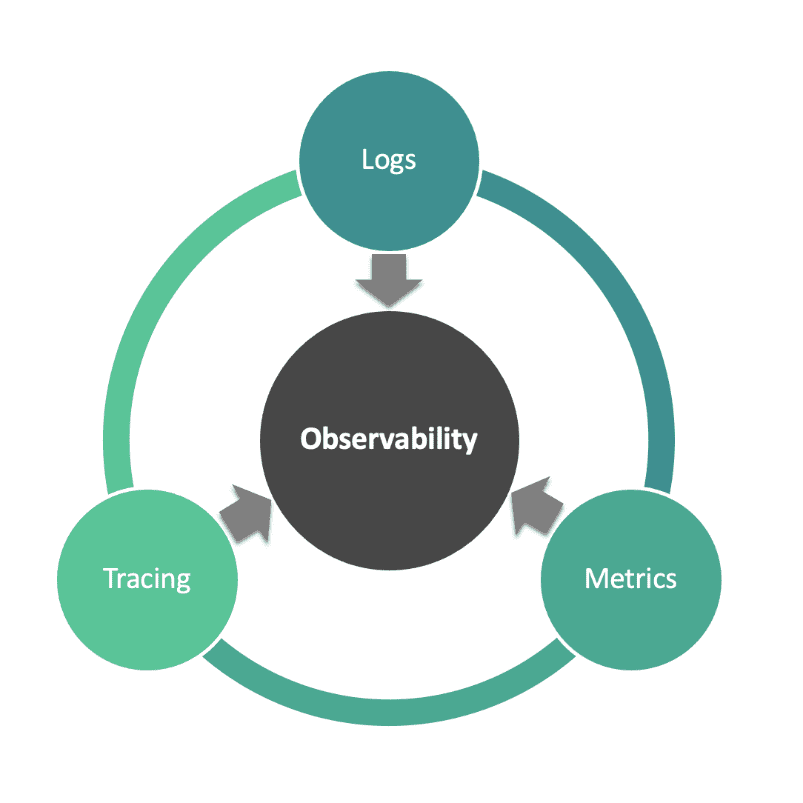
Figure 1: The three pillars of Observability
A big part of the increasing popularity and importance of observability, was the advent of open standard vendor-neutral way of tracking transactional information in a distributed system: OpenTelemetry. I recently created a set of 1-2 minute videos that quickly introduce the standard and explain how it works.
An asynchronous system with an event broker at its core – commonly called an event mesh – needs just such a standard protocol to solve mysteries about the flow of transactional events across the system.
There is a direct correlation between the degree of distribution in the system and the complexity of system observability. Advanced observability tools like Datadog enhance the tracing management of such complex systems by letting you monitor, optimize, and investigate all the different components in the system.
By stitching together tracing data from across the system, Datadog’s dashboards gives a bird’s eye view of what’s going on. With Datadog leading in the observability domain, there are still some gaps in the industry when it comes to collecting metrics from event brokers in event-driven systems
There are three levels at which traces can be collected in an event-driven system:
The advent of OpenTelemetry has led to lots of tools that generate and collect trace information at the application and API levels, but it’s been hard to trace events as they transit event-driven systems because event brokers haven’t historically supported OpenTelemetry.
I’ll give you an example: imagine an e-commerce site that offers its customers a variety of payment services. To support that, they run microservices on different cloud providers, and events flow from one service to the other. A single action, like a user clicking to pay for their order, will trigger a series of events such as checking inventory, running fraud detection, updating their customer profile, and actually charging them.
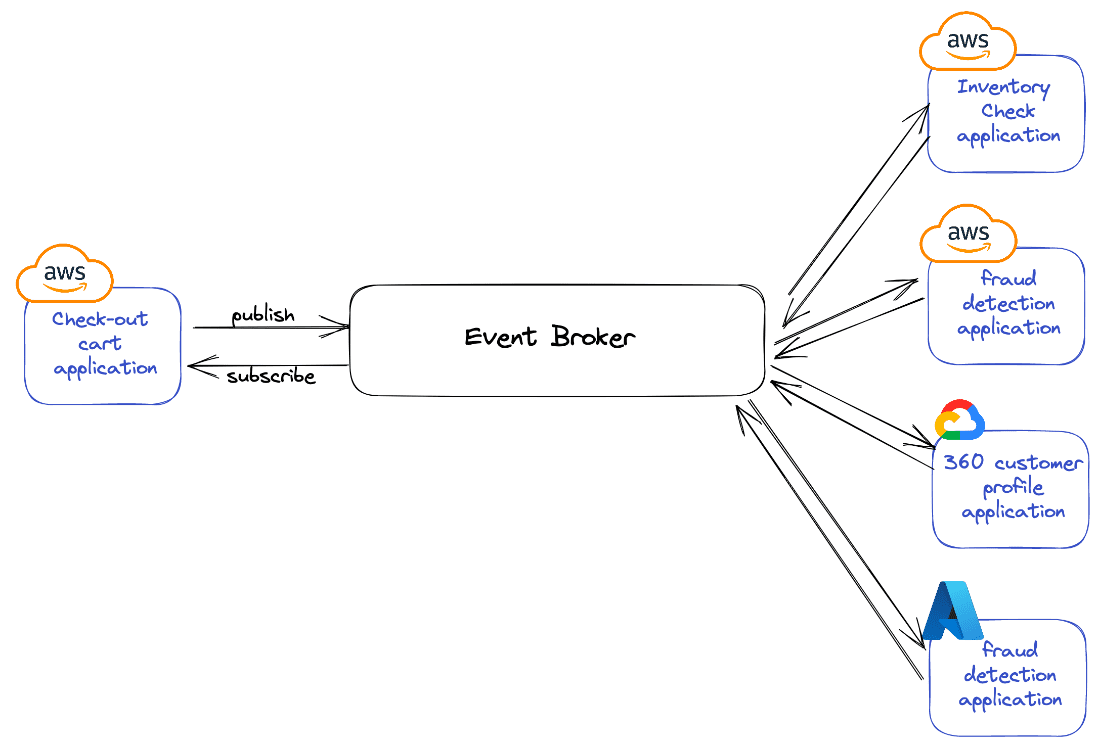
Now consider their distributed tracing strategy. Assume that events are published and subscribed to between all the backend microservices over a message broker. As a system architect or a developer, when a failure happens you might ask several questions such as:
We can clearly see an observability gap in an event-driven system. With Solace’s support to distributed tracing in the event broker and Datadog’s commitment to contributing to OpenTelemetry, we can now bridge the observability in gap event-driven architecture.
If you want a little more context, check out these 1-2 minute videos about the basics of distributed tracing in event-driven systems, and some of the specific challenges you’ll face.
As I said before, complete observability is achieved when all the components of the distributed system generate information about their actions. This includes message brokers.
As seen in the diagram below, applications can generate their own OpenTelemetry trace messages directly from the application logic, or from the API using OpenTelemetry client libraries. As applications start publishing guaranteed messages to the event broker and subscribing to these messages, the broker generates spans that reflect every hop inside broker. Activities such as enqueuing from publishing, dequeuing from consuming, and acknowledgment will generate spans that is consumed by the OpenTelemetry collector.
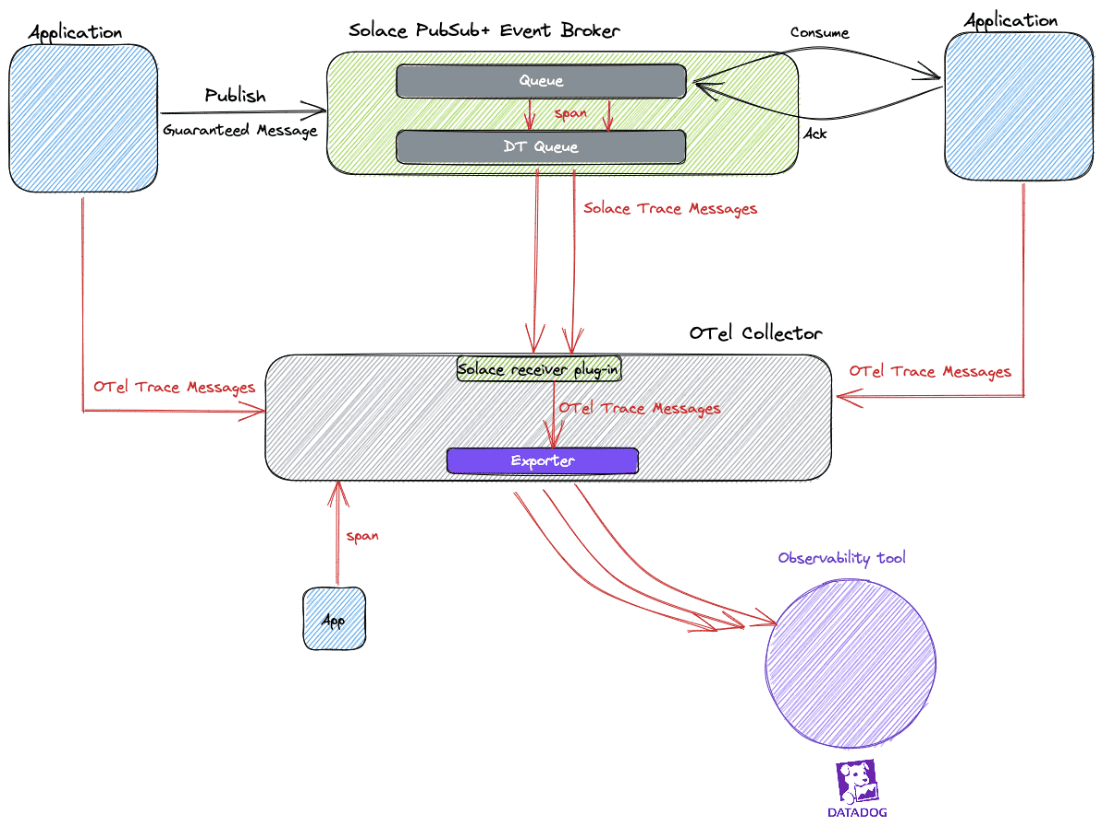
Thanks to the standardization of trace messages using the OpenTelemetry Protocol (OTLP), after the spans are received by the Solace Receiver on the OpenTelemetry collector, they are processed to standardized OpenTelemetry trace messages and passed to exporters. The exporter is a component in the collector that supports sending data to the back-end observability system of choice.
In this example, I’ve used the Datadog exporter to export the trace messages to Datadog, where they are stitched together and correlated based on several properties and traceIDs so they can be further examined and analyzed using different dashboards and tooling.
I walked through this scenario in a video about how DT works with EDA, and think it makes the concept a little more clear.
Solace’s new distributed tracing capability means traces can be generated at every hop in the event mesh to reflect the event’s entire journey, every step of the way. Using advanced observability backends, like Datadog, all those spans and traces can be correlated giving you a better understanding of your system.
Solace is committed to making its distributed tracing support in Solace PubSub+ Event Broker richer and more sophisticated over time, so keep an eye on our releases and collaborations for more cool projects!
If you haven’t been clicking through to watch the videos I created about distributing tracing and EDA, you can check out this video series here:
Explore other posts from category: For Architects


Subscribe to Our Blog
Get the latest trends, solutions, and insights into the event-driven future every week.