To take advantage of cloud arbitrage across public clouds (dynamically running workloads in whichever cloud best meets your needs at a given time) you need to continuously compare their pricing and performance.
This demo shows one way you can measure the relative performance of the big three public clouds in real-time. It consists of one application running on-prem that simultaneously publishes requests to identical responder applications running in each of the public clouds. The publisher tracks how long it takes each subscriber to respond and displays this response time in milliseconds.
What does this demonstrate?
The request-response pattern is a fundamental building block of many applications and systems in how they communicate with each other. It appears across use-cases and industries. This demo features a request-response scenario where the publisher periodically sends one message to multiple subscribers (sometimes called “fanout”) and each of those recipients sends a response back to the publisher, which then makes the result available for you to see.
- There are many simultaneous responders to the single request message
- The responders are identical code and deployed with access to the same data
- The deployments are duplicated across three cloud providers and their regional datacenters
- The response time for each received message will be measured to represent the performance of each responder
What’s under the covers?
This demo was created using the Solace Java API for the sending and receiving programs and the Solace JavaScript API for WebSocket connectivity to the same messages from this browser. A PubSub+ message broker is deployed in each of the cloud providers, which all connect back to a PubSub+ appliance in the Solace London Lab. The easiest way for you to evaluate PubSub+ for free is with our managed service: Solace Cloud.
Virtual Machine sizes in each cloud:
| Cloud Provider | PubSub+ Host | Application Host | Quick Start Guide | |
| AWS | m4.large | t2.nano | Click here | |
| Azure | Standard_D2s_v3 | Standard_A0 | Click here | |
| n1-standard-2 | f1-micro | Click here |
How is response time calculated?
Response time is calculated by measuring the elapsed time between sending the request and receiving response messages. This round-trip-time includes elements that contribute to the resulting response time, each introducing its own variability between requests, such as:
- The time taken for the request message to reach the ‘London, UK’ datacenter of each cloud provider.
(Dependent on the Public Internet and ISP used by Solace London.) - The speed and bandwidth availability of each provider’s inter-region network links.
(Dependent on the provider’s network topology and circuit selections.) - The CPU speed and availability of the server running the responder program.
(Dependent on how the underlying physical server has been virtualised and shared.)
We’ve attempted to eliminate variables on the test side of the equation (such as the geographical ‘region’ of the datacenter and the configurations of the server running the responder programs) so our results indicate the performance of the remaining elements such as network and processing speed. The response time is therefore taken to represent the holistic performance of the running responder application, with all the infrastructure variability factored in.
What do the results show?
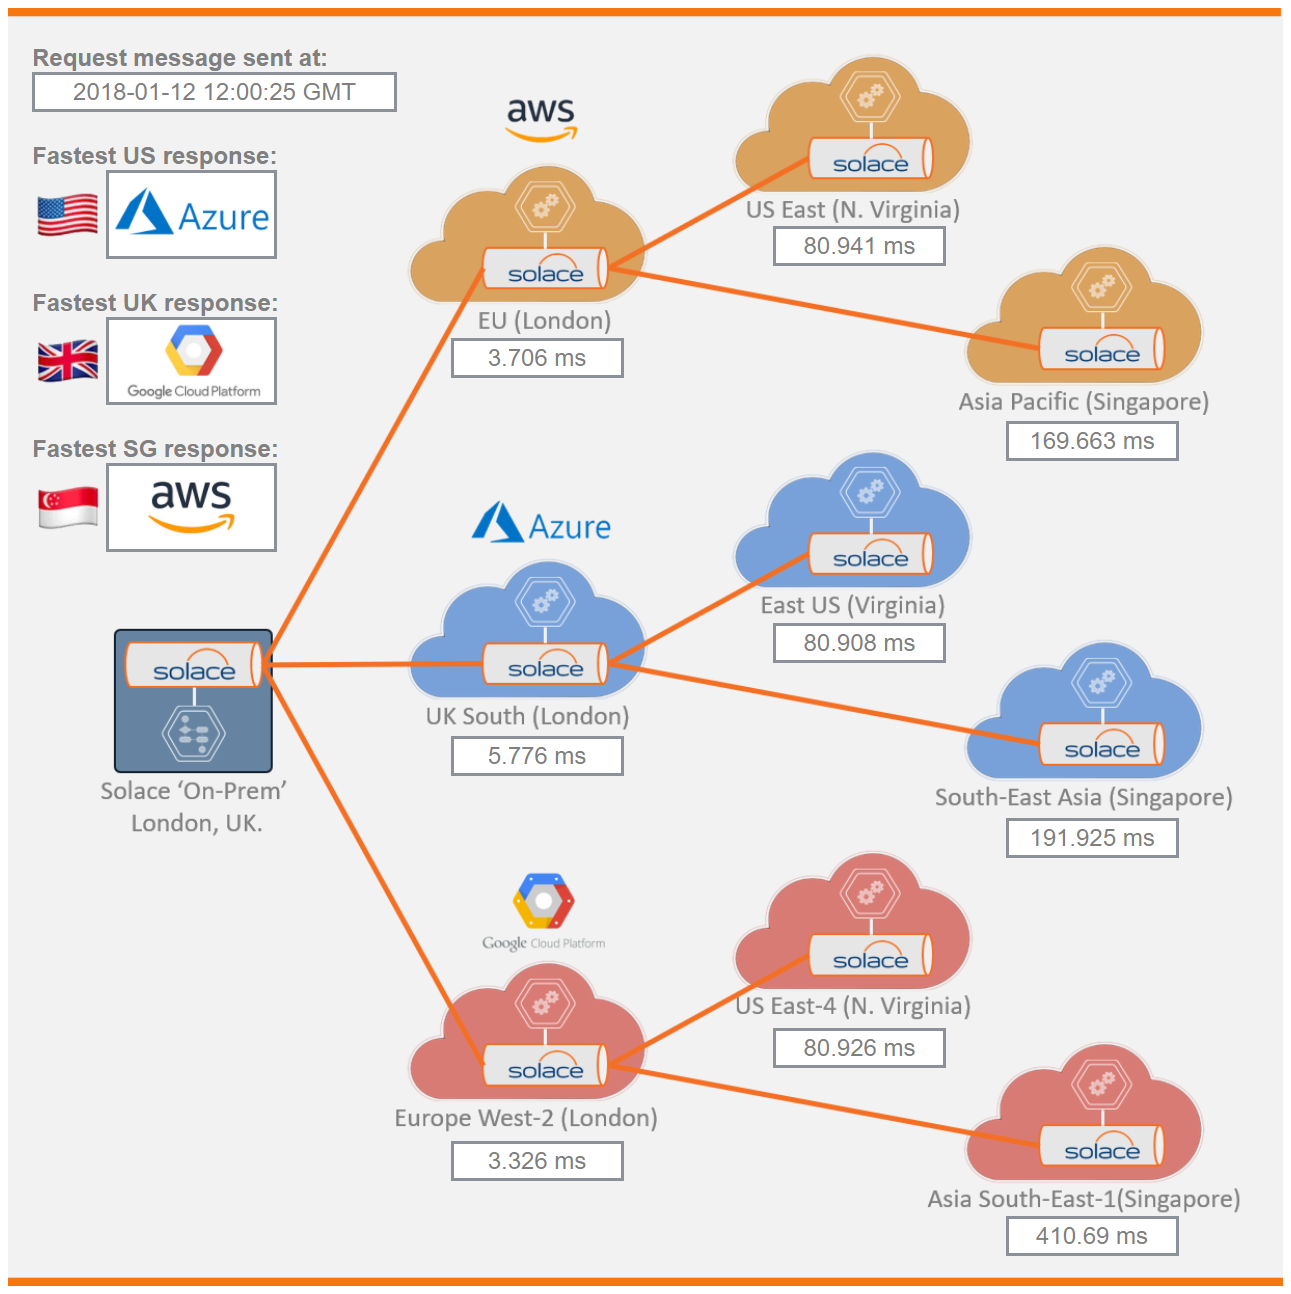
The results show round trip time from the local UK node of each cloud, and from their respective nodes in Asia and the US, specifically Singapore and Virginia, respectively.
If we look at an example result like this one, you can see that for messaging between the Solace on-prem datacenter and each cloud provider’s UK datacenter, the fastest interaction at that time was with Google Cloud.
If you are looking to do more than just “within UK” messaging, selecting Google exclusively does not offer the fastest option because messaging between the UK datacenter and another cloud datacenter in the US-East region was fastest with Azure Cloud. Since the ‘first hop’ to the Azure UK datacenter was not the fastest of the three, that means their connection between UK and US is fast enough to overcome that slow start.
Similarly, for messaging between UK and Singapore, when I ran this test AWS Cloud was the clear winner, 20 milliseconds faster than Azure Cloud, and 240 milliseconds faster than Google Cloud.
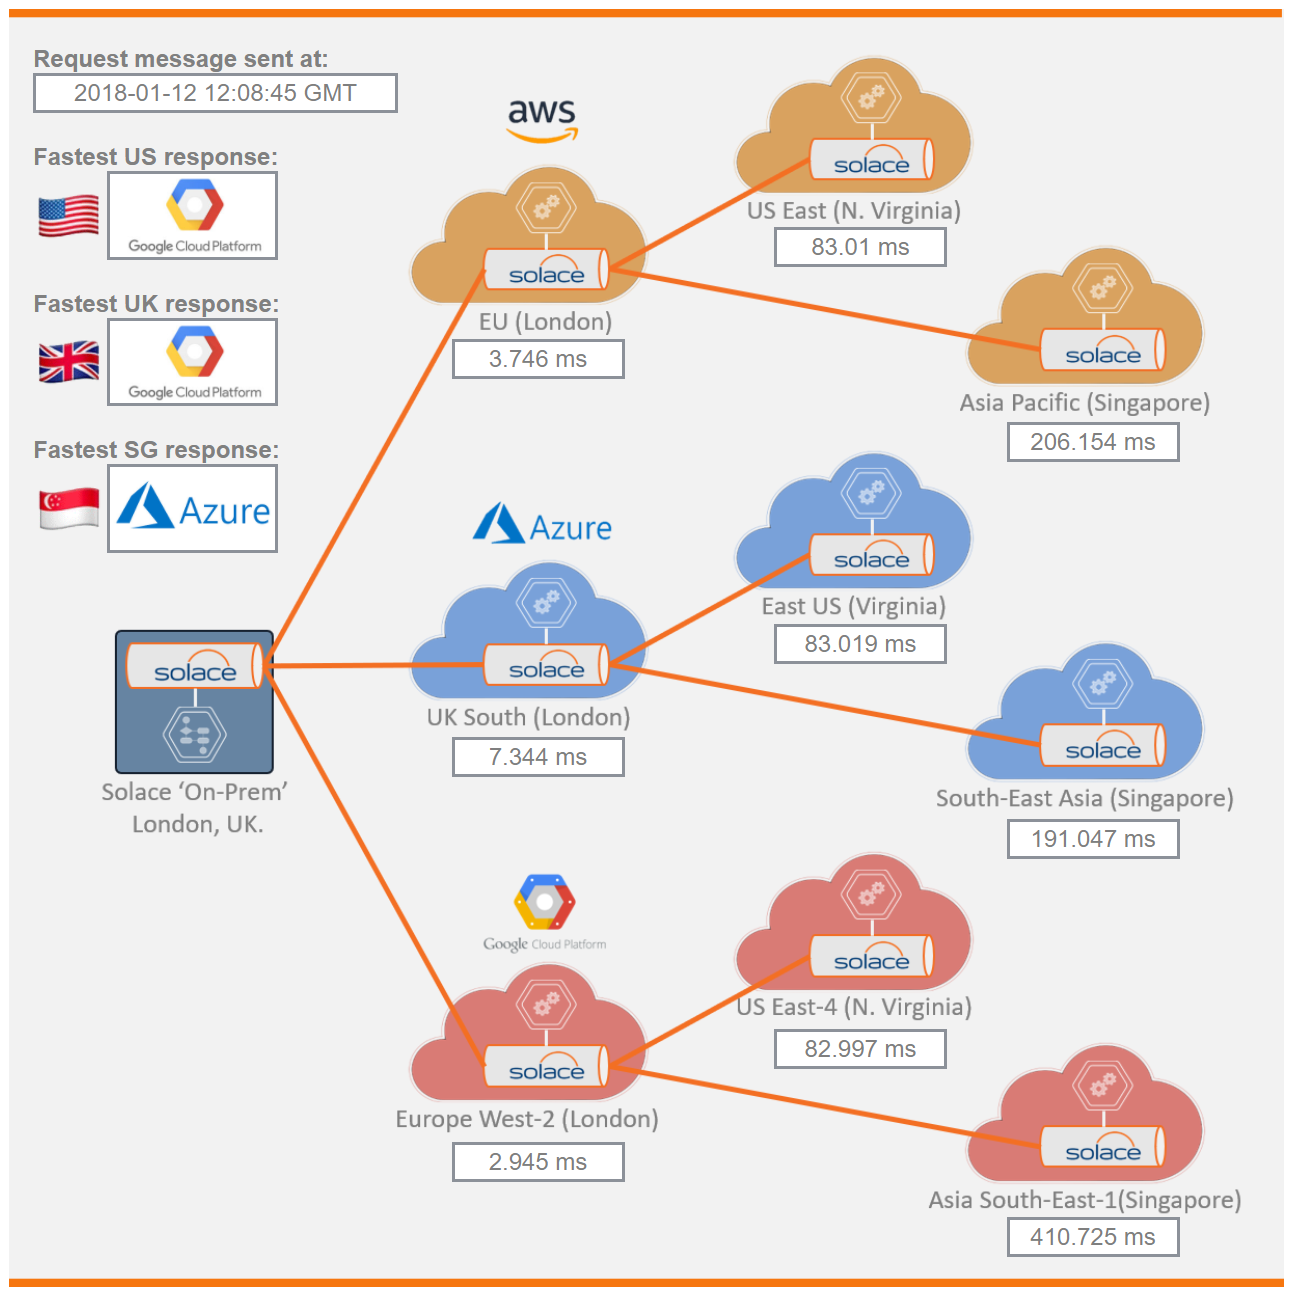
Note that shortly after that, the tool reported that AWS slowed down significantly for that path, and Azure Cloud was fastest. This is a great example of how keeping options open with a multi-cloud strategy can help you achieve the best performance in all circumstances.
How do I find out more?
Join in with the conversation and comments here. Alternatively you can email me or any of your usual Solace global contacts with any questions.


