Real-Time Use Cases in Capital Markets Part 1: Market/Reference Data Distribution
Solace is a 20-year-old company which started in Ottawa in 2001 as the world was
This is the last in my series of posts about use cases in capital markets for real-time data distribution. So far I have covered market data/reference data distribution, frontend user interfaces (UI) for information displace and collecting orders, pre-trade order processing, and now I will tackle profit and loss (P&L) reporting and risk management.
One of the biggest advantages of event-driven architecture is that it lets you distribute information to as many recipients as you want to, with whatever quality of service is appropriate for each interaction. That means every single piece of information that is routed in real-time as part of trades and transactions can also be routed to other applications and information repository for analysis or reporting. Two common and valuable ways firms take advantage of this capability is P&L reporting and risk management.
Any firm that is engaged in trading needs a reliable way of monitoring, displaying, and reporting its profits and losses. These reports can be for internal teams, stakeholders, and regulatory authorities. Moreover, depending on the trading activities the firm is involved in, these reports can be real-time and/or periodical. For example, it is common now for brokerage firms to offer web dashboards and mobile apps that have real-time P&L updates.
Additionally, portfolio managers whose job it is to ensure their portfolios outperform the market are constantly checking their portfolio’s performance. These P&L reports can come in various forms depending on who the end consumer is – dynamic HTML5 web dashboards, static Excel reports, and/or mobile app.
To calculate P&L, applications typically require a variety of data. First, you need to know what your holdings are, so you know which securities to calculate P&L for. This can come from a static data warehouse (such as a security master), or it can be pushed to P&L application in real-time as orders are executed by EMS application. Secondly, you need reference data for managing different symbologies and corporate actions. This is usually static data stored in some relational database since it doesn’t change very often. Finally, you need live prices to be able to calculate your portfolio’s performance and for that you need real-time tick data.
If you are distributing tick data and execution data over Solace PubSub+ brokers already, it becomes extremely easy for the P&L app to simply subscribe to the appropriate topic directly or via queues and consume real-time data. This allows P&L application to use different protocols based on how it intends to display the P&L report. For example, if it is via an HTM5 dashboard, it can use websockets to subscribe to live feed from Solace brokers. Additionally, the P&L application can also republish the calculated P&L data back to PubSub+ brokers so downstream applications can subscribe to it if required.
White Paper: Accessing Real-Time Market Data in the Cloud with SolaceDelve into the business case for cloud-delivered market data; how an event mesh can help deploy that real-time data; and how to start the journey towards making it a reality for your organization.
Another operational area where EDA can help financial institutions is the management of risk. The risk factors financial institutions face today are many and varied:
Risk management has been at the forefront of capital markets since the fallout from the last economic crash brought about changes in regulations in terms of measuring and mitigating risk. The aim of the new regulations is to insulate the financial system against a rapidly changing operating environment and increasing global uncertainty.
To combat increasing uncertainty, most organizations have adopted technology frameworks that can meet changing requirements over time. The changes may be in terms of the algorithms used and/or involve changing information inputs and calculation ‘output destinations’ over time, as the business changes. Many organizations are also building the risk management frameworks with elasticity and ‘cloud’ in mind, even if the data sets have not been given the ‘green light’ by regulators.
Measuring the risk associated with a given business action applies not only to each individual activity, but to the aggregate of activities associates with each line of business, set of divisions, and the organization as a whole. As such ‘risk’ may be many applications that often share, or will share, this common framework.
That means the requirements for risk inputs and outputs are diverse, and the mix will change for each application running within the risk framework. It is also likely that, given the hierarchical nature of organizations, the calculation output of one application may form the input of another. For example, front office risk pricing outputs might feed cross portfolio risk calculations, which may feed a group risk function to provide an aggregated market risk calculation.
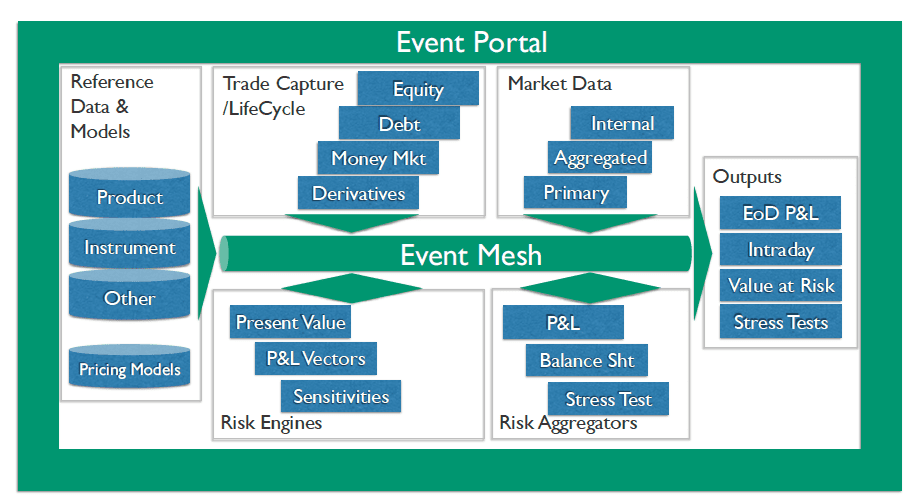
Figure 1: High level risk framework, inputs and outputs
There is also a requirement to move from end of day ‘batched’ risk calculations to something much near real-time. This is driven in part by the hierarchy of risk systems but also by the requirement for newer systems to have better quality risk data in order to make a decision. This also drives a requirement to be certain of, and track, the quality of the data used to make decisions on the exposure to risk.
The technology stack deployed for risk solutions is, in many cases, morphing from grid computing systems to more cloud friendly, micro-service style deployments, that run the compute workload – the compute or processing engines. The number of processing engines can number anywhere from a few thousand to many tens of thousands depending on the data being processed and the algorithms running. Data may be spread in ‘shards’ with each shard processing a portion of the input data, data may be pipe-lined through a number of compute engines, each doing part of the job, or a mix of both approaches.
The data input for the calculations will be sent to the compute engines from data sources or data publishers. The published data will flow over a publish and subscribe event broker, such as Solace PubSub+, to be consumed by the processing engines. Once the processing engine has finished its calculation it publishes its result for consumption by a downstream subscriber. Whether the downstream subscriber is another system or the next processing engine in the pipeline, or both, is defined by the topic subscriptions and published topics in the system. As such, the system is flexible enough to allow dynamically configurable workloads.
The use of high performance, guaranteed messaging for the publish and subscribe event broker, such as Solace PubSub+, decouples the communicating parties so each can operate at its own speed while ensuring that processing engines and pipelines are kept busy and that data is not lost.
How Solace has helped RBC Capital Markets transform their messaging system.RBC Capital Markets has deployed Solace PubSub+ appliances to act as the message bus of their low latency trading platform.
Data quality is often cited by regulators as the biggest obstacle to correct and effective risk reporting. Within a large organization, there are often many separate teams that contribute to the risk ecosystem. The ability to loosely couple ecosystem components using publish and subscribe technology aids application and ecosystem flexibility. However, the decoupling at the technology level often leads to loose coupling at the team level which can cause misunderstandings and problems.
To mitigate the two points cited above, PubSub+ Event Portal can document the interfaces into and out of the risk system, and document and control the publishers and subscribers that connect to the system.
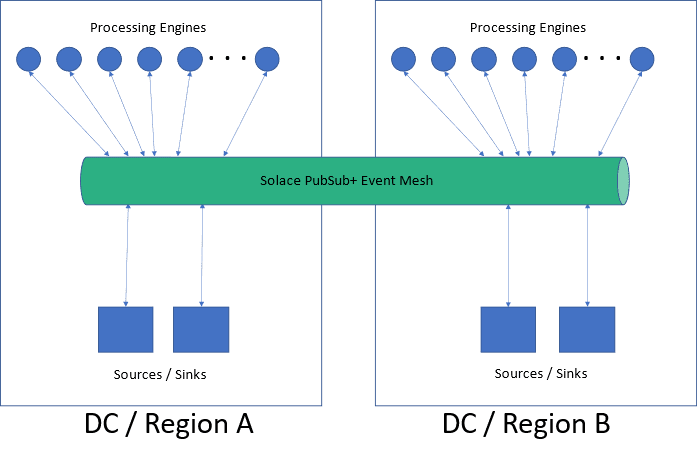
Figure 2: An event mesh can span multiple datacenters making it easier for applications deployed in a datacenter to leverage events published in other datacenter.
That means the organization can document and categorize the quality of the data available from the different sources. The centralized and standardized documentation also make it easier to share application architecture, and information about events, such as description, subscribers and publishers, schemas, and topic formats, with different teams in an organization. Improved documentation and communication lead to improvements in lead time and reduces mistakes.
In terms of physical deployment, the risk system will span data centers in large organizations, if deployed on-premises, and perhaps spans cloud regions if deployed in the cloud. In this case the compute / processing environment is typically deployed and active in both data centers. The event broker is configured to span both data centers, connecting to both sets of processing engines, joining then to form a distributed risk environment that is able to satisfy organization business continuity requirements and survive a complete data center outage.
Be sure to check out these other posts in the series:
Explore other posts from category: Use Cases


Subscribe to Our Blog
Get the latest trends, solutions, and insights into the event-driven future every week.