Observability is a rapidly growing need being served from (primarily) the application performance management (APM) space that includes vendors like DataDog, Splunk and Dynatrace. It encompasses a lot of concrete use cases and a few that are a little more future-forward. The focus here is on event-driven architecture and how observability serves today’s needs and tomorrow’s possibilities. For those new to event driven architecture (EDA), an event mesh is a network of interconnected brokers streaming events dynamically throughout the organization from publishers to subscribers. It is critical to decoupled architectures.
Sounds like someone is trying to sell me on the next big thing.
Where’d the need for “observability” come from?
Monitoring is the granddaddy of keeping tabs on a system while it is in operation. Gauges and blinking lights told you what was running properly and what was about to melt down. Back then it was a big room filled with shirt and tie clad operators watching a hundred different parameters. Today it is computers in operations centers monitoring far more data.

In some sectors, machine learning takes it even further to watch over entire complex systems and create alerts when something even looks like it is behaving differently than normal – even if it was never told what “normal” was in the first place. As it pertains to the event mesh, it allows for data and analysis in decoupled environments and a true end-to-end look. But I am going too far too fast – so read on.
There have always been gaps in what people wanted to monitor versus what they could. Top level metrics don’t necessarily provide the capability to validate/confirm/debug/audit and so required technical people to undergo complex investigations of the inputs and outputs to determine the system state. Like everything else, providing more capability for observing has a cost, and that cost must be less than the returned benefits and less than the cost of continuing to work the way you always have. In the current environment three discontinuities have come along to require and enable the next generation of application performance monitoring and observability.
- Complexity: Microservices and distributed development environments have created new problems in managing complex decoupled environments. We’re talking hundreds of things connected to hundreds of things and without a well-defined architecture many organizations don’t even know what is using what – but they sure know they get a big monthly bill.
- Quantity: Applications are coming out of the box instrumented to provide a firehose of data. This is in addition to the developers adding telemetry to their in-house applications. This means there is a huge quantity of data that can’t be monitored using traditional methods.
- Cost: Cloud computing in general has reduced the cost to collect, store, and analyze data while APM vendors in the space have made remarkably sophisticated software that is generally cost effective versus the bespoke systems of the past.
The Three Pillars of Observability
Observability is the practice of analyzing/inferring the internal state of a system by watching its outputs. It is generally described as having three pillars:
- Metrics: Real time data about the performance and health of systems.
- Logs: Information about events (and errors) that happens in software environments.
- Traces: Insight into the flow (by time) of events as they are processed along the way.
It is the inclusion of traces that has unlocked the full value of observability. For full detail on this we have produced our own whitepaper focused on distributed tracing in event driven architecture. Traces come out of software development and were traditionally used during the development and debugging process.
Since then, distributed tracing has become more mature, ubiquitous and operationally focused. The OpenTelemetry standard for distributed tracing has emerged as one of the most popular Cloud Native Computing Foundation (CNCF) projects ever. The ability to trace across different environments has become a reality, and observability is now going mainstream. While it is mainstream – it is notable that some of the more grandiose promises of observability are still visionary in nature. Because Solace supplies critical infrastructure, I will keep our discussion of the topic grounded as I explain the differences between monitoring and observability.
Solace Platform Offers EDA Observability
Solace Event Broker is a mature event broker that makes a full library of syslog data available for forwarding, and Solace Insights provides monitoring metrics about cloud broker operation and event flow (in the cloud) – covering off both monitoring in the application and using third-party tools. The event broker also natively implements the OpenTelemety standard for distributed tracing while the cloud services come with out of the box support for several APM tools and supports OTLP exporters to any tool of your choice. Combined, you meet the observability trifecta. This applies to so-called traditional uses for APM tools for observability. But as a catch-all category it even applies to Solace Event Portal that can be used to discover events and let developers and architects use and deploy them. Remember that although observability has come to the fore with tracing, it delivers on much more when the notion of observability is applied to, for instance, discover topics being published across your systems, Solace, Kafka, and others.
This is important, because until now, organizations investing in observability were able to do so between applications and microservices but once they entered the event/messaging layer they became a dark box. You could only see what went in and came out. Solace Event Brokers are a native implementation of OpenTelemetry so the APM tools get the data they need for full contextual tracing and get it in a more performant manner for production. With a non-native implementation, the event brokers that make up a mesh are a black-box because you can only track the ingress and egress. This isn’t a bad thing, but it isn’t the best and it doesn’t deliver on the promise of observability.
When do I “monitor” and when do I “observe”?
One way to think of monitoring is, if I can define a key performance indicator (KPI) then I can monitor it. This is traditional thinking, and it still applies. Organizations deploying any software or hardware or even a cloud managed service will naturally monitor the health of their operating environments. It could be simple, it could be sophisticated, but to not monitor system health is generally not a best practice. One such system is the event mesh which routes data and events between decoupled applications.
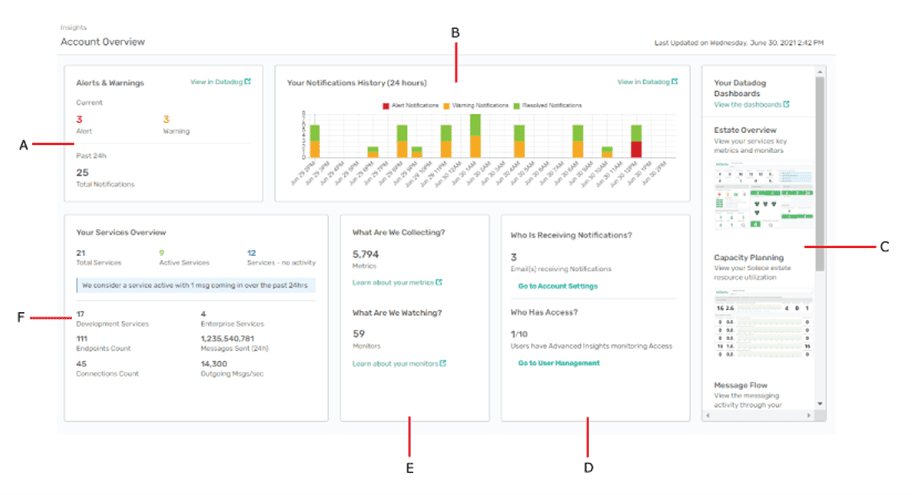
Monitoring typically provides for metrics gathering, baseline operations, users, and alerts based on things being out of normal parameter. Here the administrator is watching alerts (A), notifications (B), other dashboards (C), users (E), what is being collected (E), and an overview of services (F)
Monitoring is used by the middleware teams and architects that are responsible for the efficient operation of the event brokers that make up the event mesh. This team is less concerned about the applications or the developers code but is concerned that what they produce can move efficiently. In the context of a small deployment it may be the application architect keeping tabs on their broker(s) while in an operations center this may represent a few screens that provides performance metrics for event brokers, at a glance overview of the messaging estate, dashboards showing broker capacity usage, message flow rates, queues, endpoints, bridges, and more. This includes dashboards and reports that can allow for deeper digging when needed.
Monitoring allows for keeping track of the system health, allowing the operator to see if queues are filling-up, failing, or are misconfigured. Because KPIs are defined at the outset, alerts can be used to determine if the system is falling outside of expected parameters.
What Does Observability Offer in Context of EDA?
Observing a system can include both traditional monitoring and architecturally understanding your complex system. In a real-world example, when Solace customers using Kafka clusters engage with us and use Solace Event Portal to discover their streams, they discover a lot of cluster replication that is happening with topics that don’t have consumers. In many cases this is costing them a lot of cloud resources – that in todays environment is a direct out of pocket variable expense. Without having the ability to discover and observe what is happening this cost goes unnoticed. In short, observability goes beyond traditional dashboards and supporting it in event-driven architectures is core to Solace and our customers. Learn more about Solace Event Portal.
Here are four things you can do with observability:
- Troubleshooting: First, by preserving the context in the traces it makes troubleshooting problems much faster because you are able to identify specific events on the event mesh that includes information about the publisher and the subscriber. It allows for much faster identification of the problem.
- Debugging: Second, it makes debugging during development much faster because you can quickly identify any misconfigured topic subscriptions and correct the error and quickly point to the possible source of other problems. Due to its decoupled nature, one of the most important concepts in EDA, it is critical to be easy to establish mean-time-to-innocence. When something goes wrong the first step often involves teams pointing fingers and if the team managing the EDA can quickly establish that an event was received and sent, it allows the focus to be put on the code versus the network or messaging layers.
- Data Lineage: While related to troubleshooting and debugging, this capability also introduces the third use case being the establishment of data lineage. Data lineage is a complex practice but as it applies specifically to EDA, it is focused on proving an event went where it was supposed to AND did not go where it wasn’t. Both notions are very important to corporate compliance and audit functions.
- Monitoring and Optimization: And finally, the fourth use case brings us full circle by putting monitoring on steroids and this allows for better monitoring and optimization. By tracing events you add time spans to the data which can be used by operators or machines to identify a change. By keeping the context from end-to-end, organizations can evolve and optimize their systems based on where bottlenecks occur.
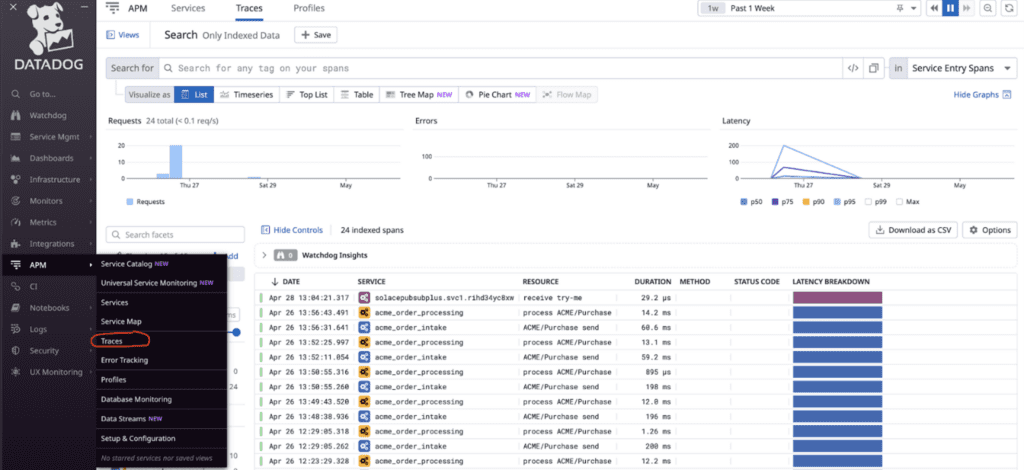
Observing traces in Datadog – using Solace Insights – simple view of the trace duration can be used to identify inefficient processes to target for improving the code simply by looking at the span duration.
Event Brokers as a Tool for Instrumenting Applications
Some things weren’t designed for observability – e.g. thin clients, machines, IoT devices, or legacy applications. Some teams don’t have the time or resources to add OTel code and collectors to legacy applications because there is just no ROI for full observability. With an event broker you are receiving or sending an event between systems, which means the addition of tracing to otherwise un-instrumented events gives you visibility into them. Is it truly end-to-end? No, but being able to trace the flow of events into or out of those systems can help identify where a something did or didn’t happen, so event brokers do play an important role when new coding isn’t pragmatic.
Conclusion
Is observability incremental progress or a fundamental shift in enterprise application performance management? Yes, it’s both!
I posited in the introduction that observability is the evolution of monitoring. Monitoring in its traditional sense is as important today as it ever was, but by leveraging traces as the third pillar, teams managing event brokers and event meshes can do so much more in their day-to-day operations. This can include making it easier for developers and DevOps teams to detect and debug problems. It can include feeding data into the broader organization to help keep complex microservices environments operating at peak efficiency. It can include the provision of proof for compliance and audit. For Solace, its native implementation in our event brokers gives our customers what they need to truly benefit from the evolution.
As we look to the future promise of observability – standing on the foundations of logs, metrics traces – it can provide for system-wide analysis in ways that were impossible before.
Explore other posts from category: For Architects


Subscribe to Our Blog
Get the latest trends, solutions, and insights into the event-driven future every week.