Gartner’s Advice on How to Choose an Event Broker
Note: A new blog post featuring more recent Gartner research has been published, and should
If you are an architect or a developer at an asset management firm, I want to make your job a bit easier by showing you a system and a platform that can help you understand the flow of event-driven information throughout your organization.
For starters, imagine being asked to explain your entire workflow to an auditor…where do you even begin? In this post, I will show you how a new type of software called an event portal can generate a visual map of your event streams and workflows and make it easy for you, your team, and your auditors to get their jobs done. I’ll do so by walking you through what the architecture a mid-size asset management firm with a moderately complex tech stack might look like in Solace’s PubSub+ Event Portal.
Typically, you would use PubSub+ Event Portal design the flow and then implement it using Solace’s PubSub+ Event Broker or another event broker of your choice.
Gartner’s Advice on How to Choose an Event Broker
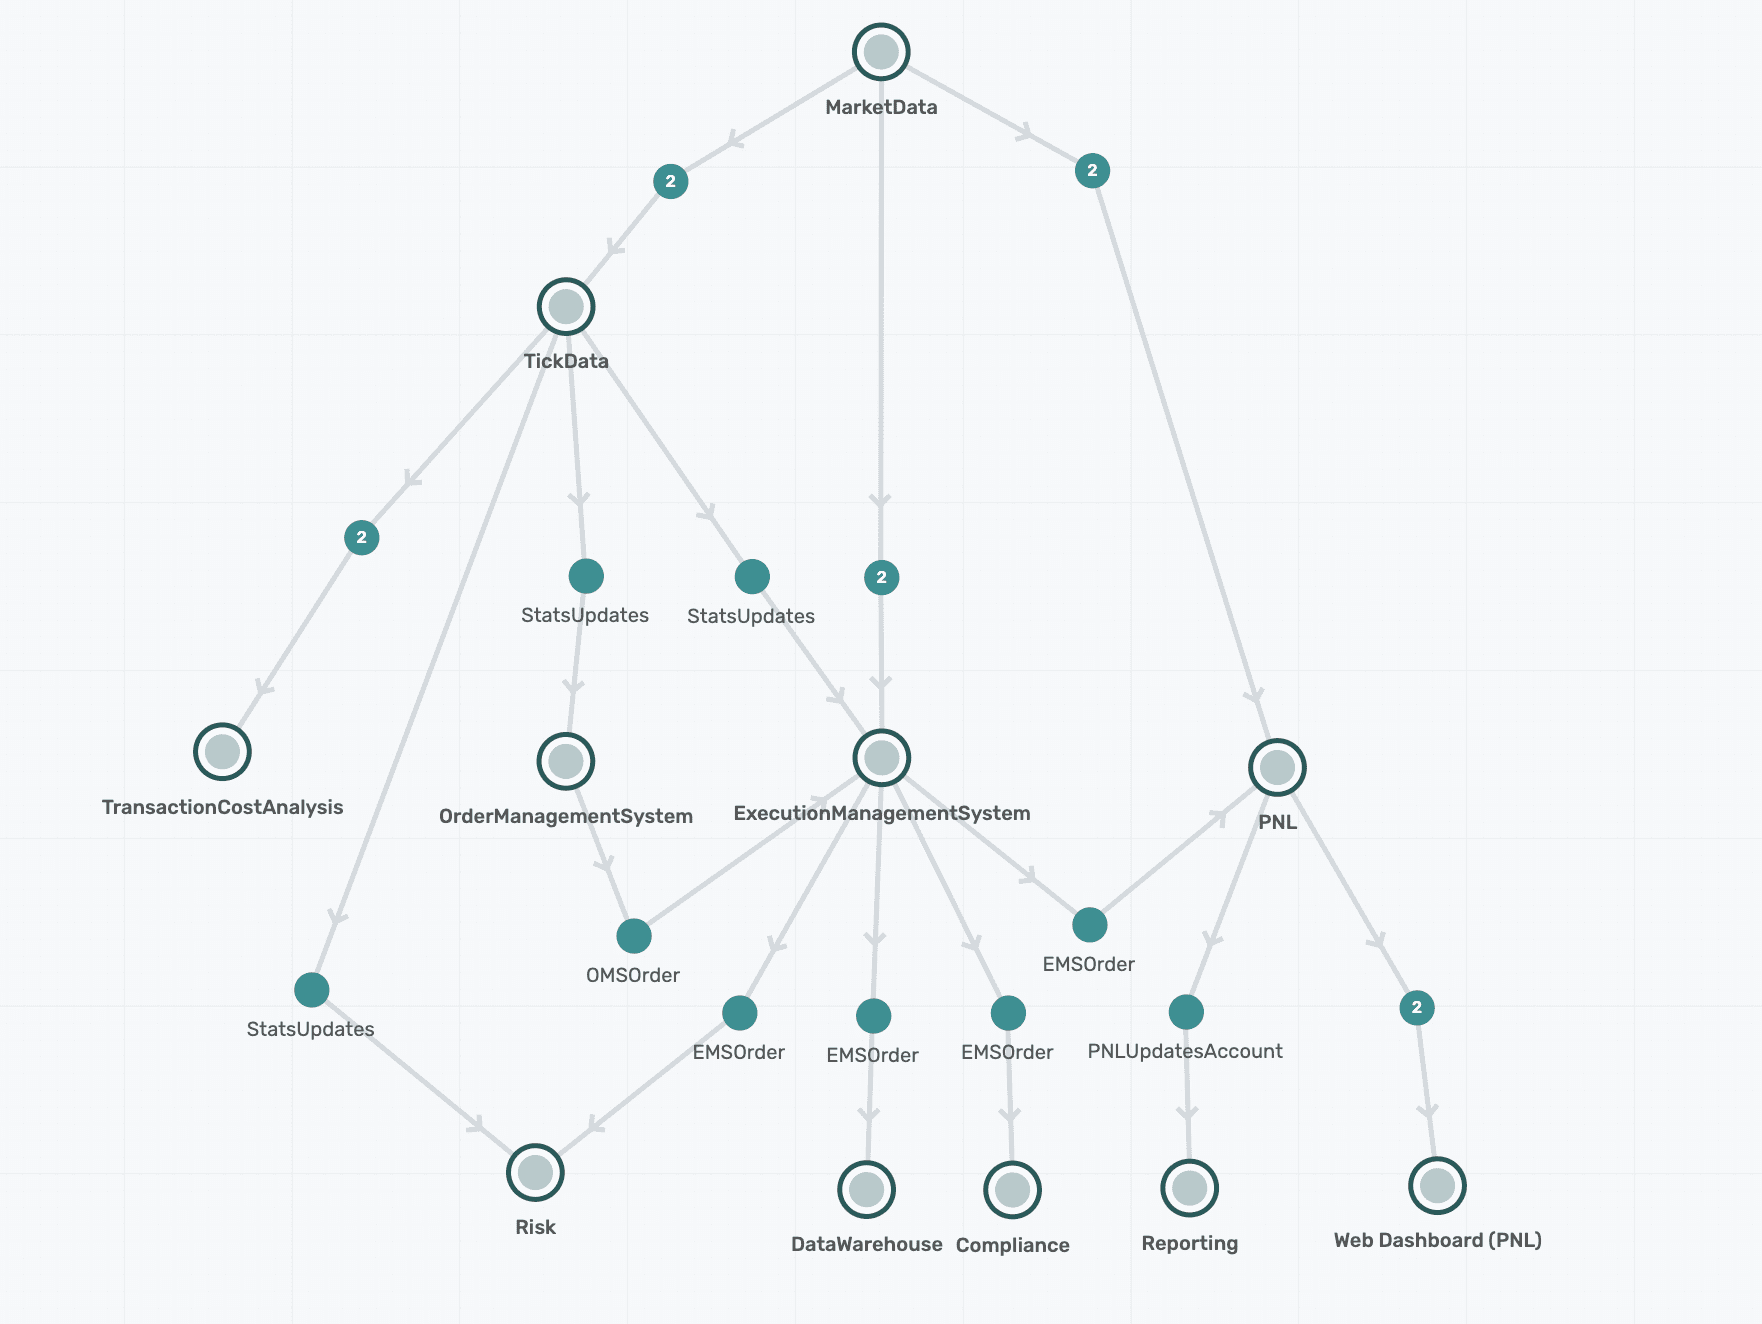
Given my background in market/tick-data, I have focused more on the flow of pricing data and different events associated with the systems that interact with this data, either directly or indirectly. An asset management firm has several other applications, such as reference data, that have not been shown in this flow architecture, but this gives an overview of what the trading architecture might look like at an asset management firm.
If you prefer to watch me walk through this example, check out the video below; otherwise, I’ll get right to it with a break down of each application and what events they publish or subscribe to.
Starting at the top the Market Data application connects to market data providers and distributes data to internal clients via a real-time feed or end-of-day batch files. To avoid dependency on a particular feed, an asset management firm might want to source data from multiple feeds so if there is an outage with Reuters feed, you can quickly failover to Bloomberg feed and vice versa, for example.
You can click on the application in PubSub+ Event Portal and see details including a description, owner, tags, and the events it publishes and subscribes to, as seen here:
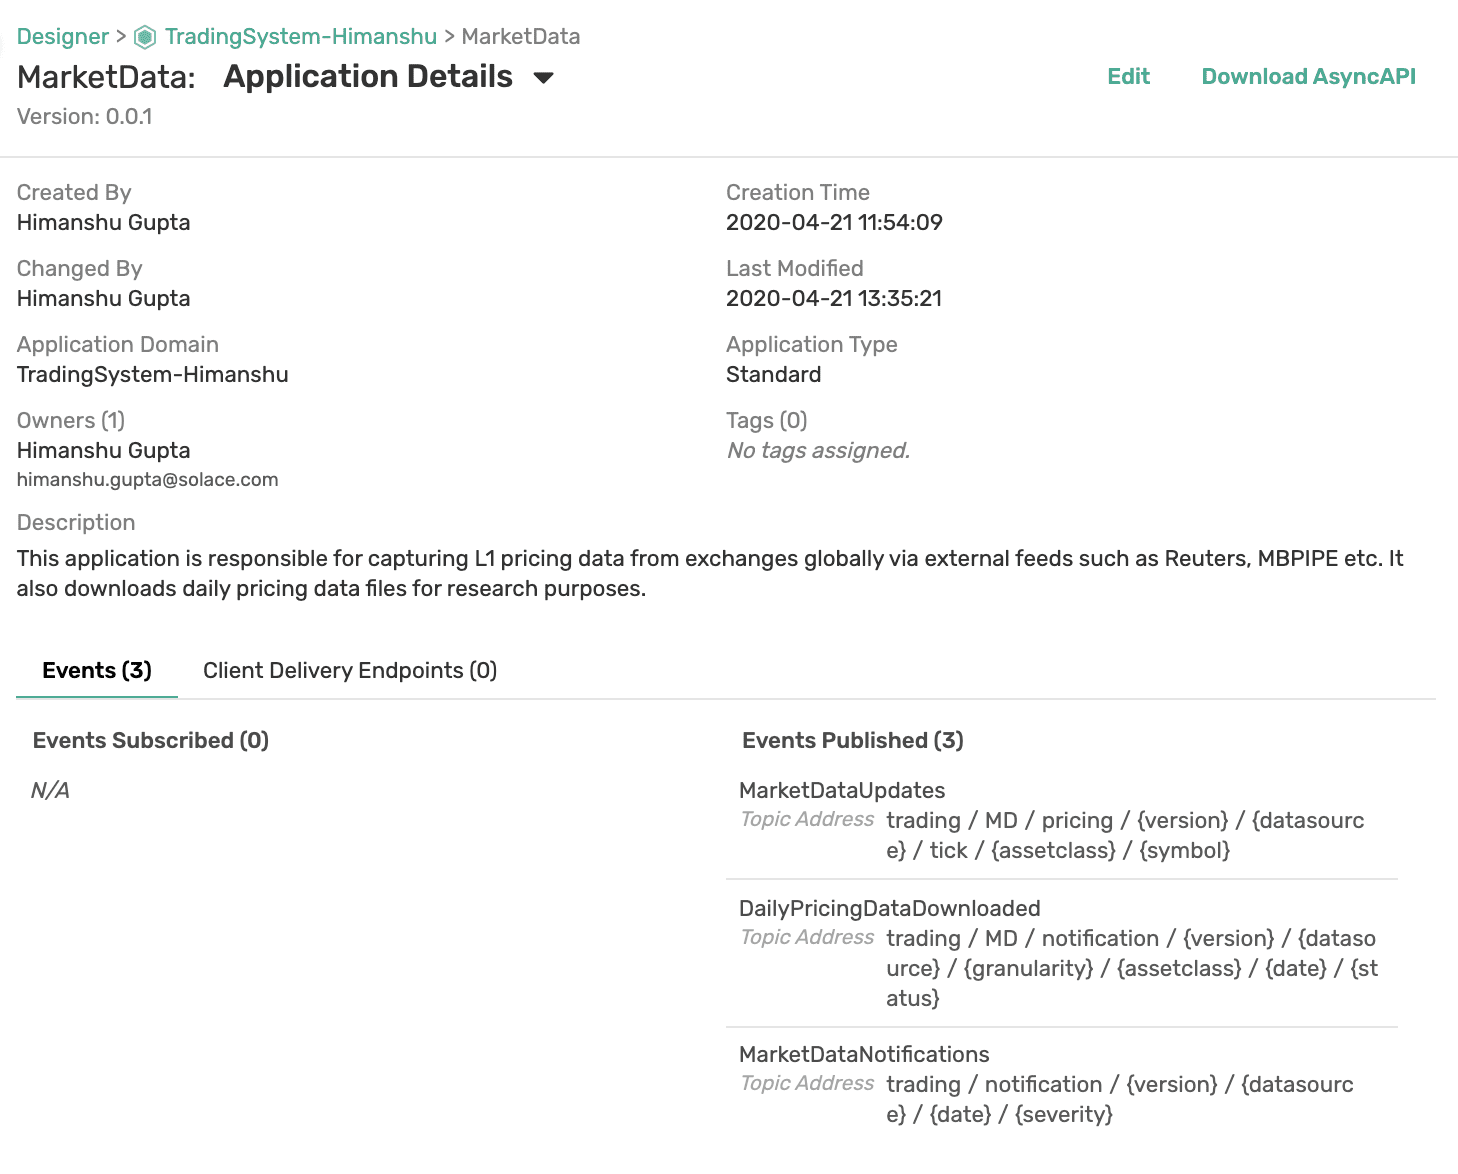
The MarketData application is not subscribing to any events (since the market data providers are external and out-of-scope). It does, however, publish 3 events: MarketDataUpdates, DailyPricingDataDownloaded, and MarketDataNotifications. And as you can see from the screenshot, the topics that these events are published to as well. For example, MarketDataUpdates event is published on trading/MD/pricing/{version}/{datasource}/tick/{assetclass}/{symbol}
So, what do these events do? MarketDataUpdates event is fired off whenever there are real-time tick updates. For example, when the stock market opens and securities start trading, their price updates are published as events in real-time. A sample topic AAPL’s price updates might publish on would look like this: trading/MD/pricing/v1/RT/tick/EQ/AAPL. In this topic, MD stands for Market Data, RT stands for Reuters, and EQ stands for equities.
Of course, real-time feeds have outages whether caused by an issue at vendor or exchanges which need to be communicated to downstream users. These notifications can be published via MarketDataNotifications on trading/notification/{version}/{datasource}/{date}/{severity}. For example, users can be notified of a Bloomberg feed outage via an event published on topic: trading/notification/v1/BBG/20210623/CRITICAL.
What about historical data? If a firm is not using event-driven architecture, typically, its workflow would look something like this when it comes to sourcing historical data daily. A vendor will give you an idea of when you can expect batch files to be dropped on some FTP server (let’s say around 1am for previous day’s data). Of course, the files won’t necessarily be ready at 1am but you can start checking after 1am to see if the files are available for you to start processing. So, you build a process on your end to keep polling for updates. Is it there yet? Is it there yet? Once the files are available, you download them locally, process them, and load them into a tick database. While this is happening, your downstream consumers are polling to see if the data has been loaded. Is it loaded yet? Is it loaded yet? And so on…
However, if the firm and the vendor were using event-driven architecture, the vendor will send an event to all its consumers when files are available which will trigger firm’s download process and then it would send an event such as DailyPricingDataDownloaded and let the Tick Data team know that the files are available to be loaded into the tick database.
Next up, the application responsible for capturing this real-time and historical data and loading it into a tick database such as kdb+ or OneTick. (Note: PubSub+ Event Broker has connectors to both of these timeseries databases: kdb+, OneTick)
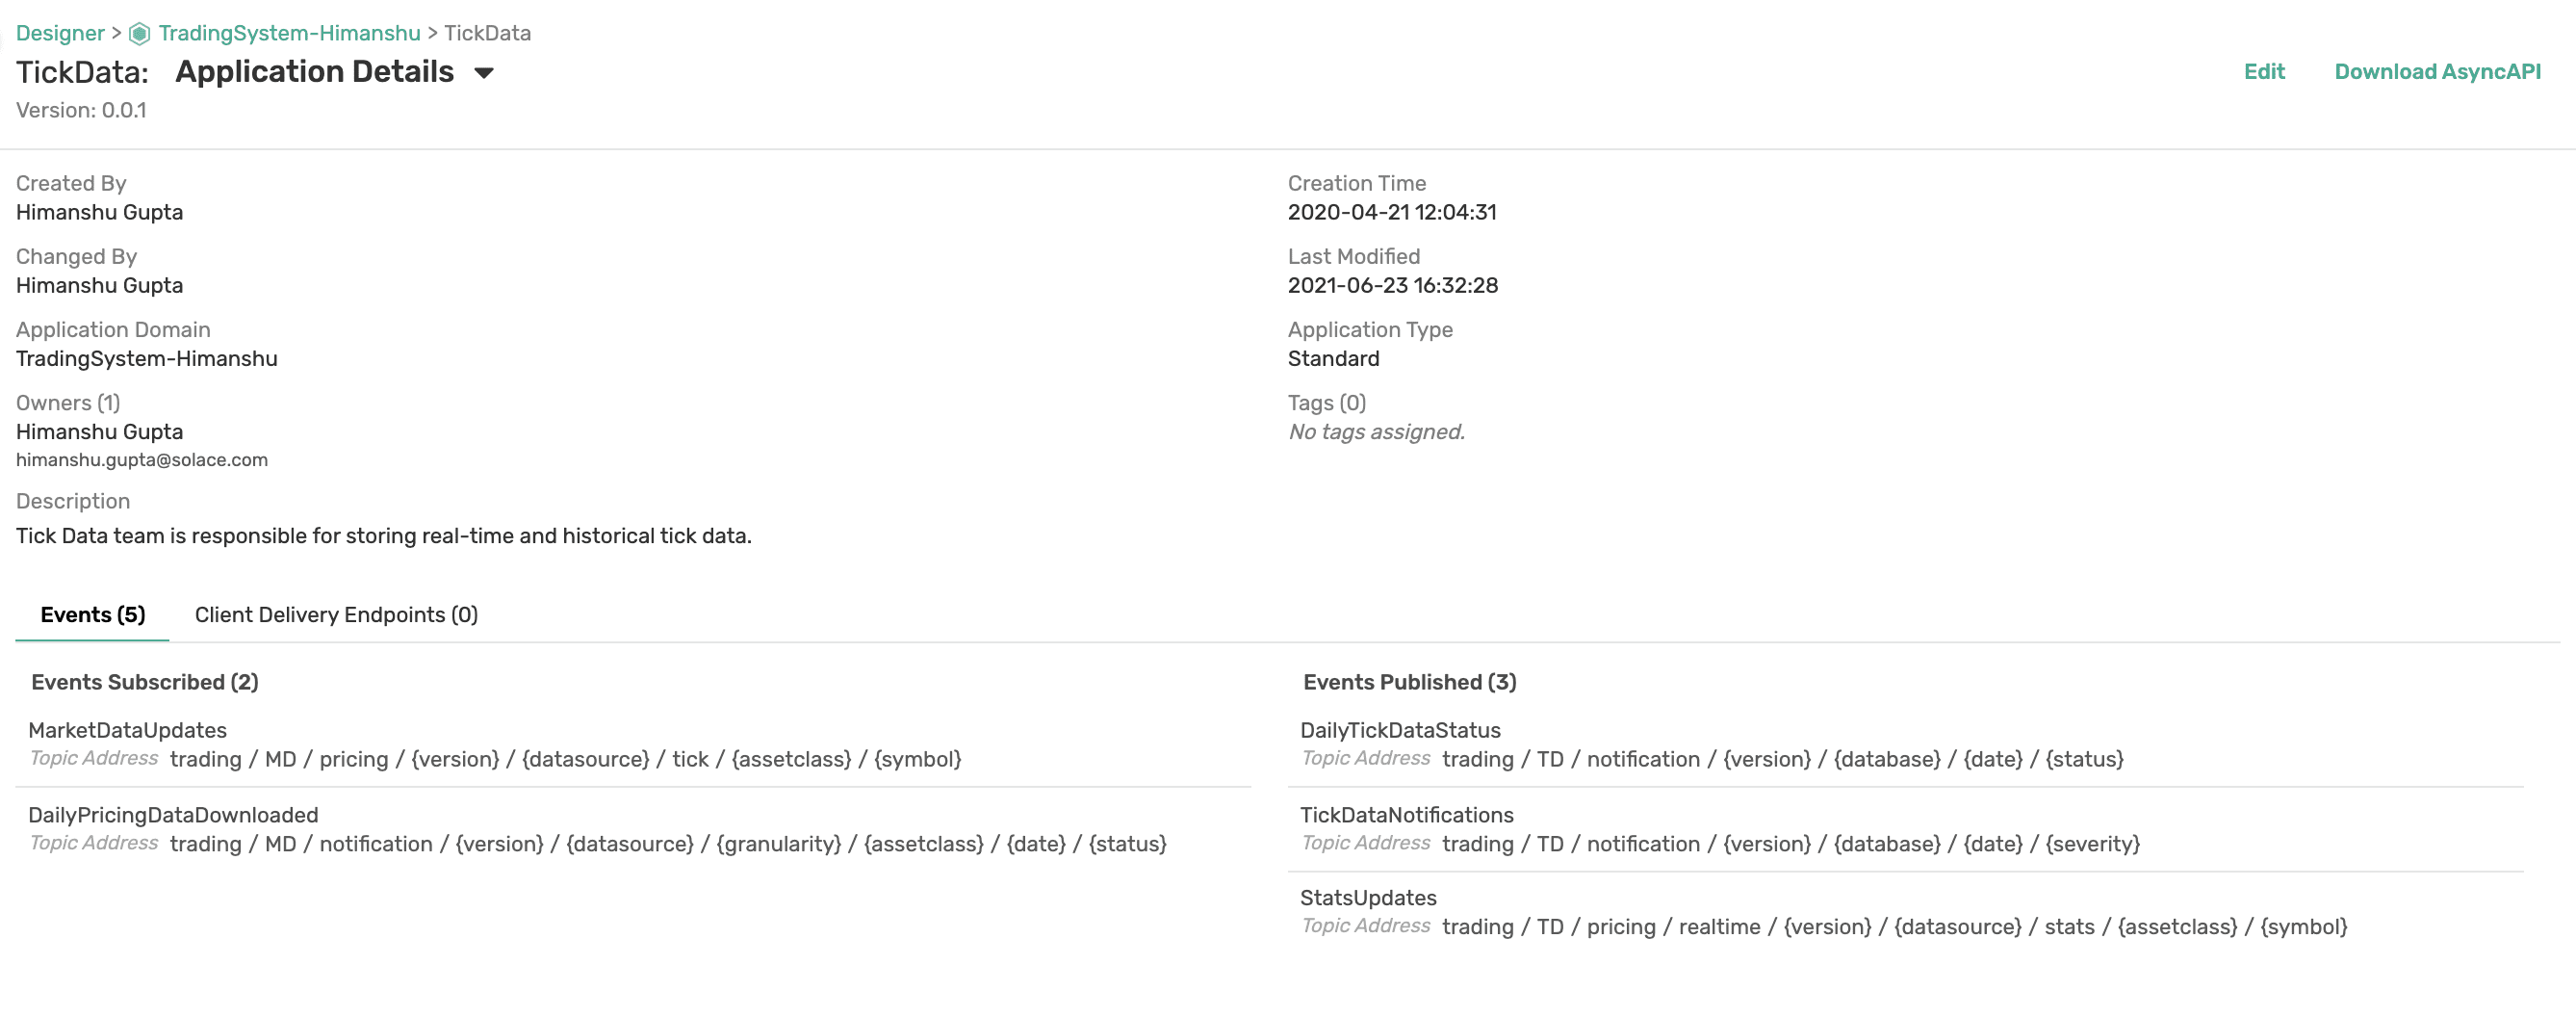
The TickData application is both publishing and subscribing to events. It’s subscribing to MarketDataUpdates events to capture all the real-time data from different feeds and it is subscribing to the DailyPricingDataDownloaded notification so it knows when to trigger processes to load historical data.
Additionally, it is publishing three events: DailyTickDataStatus, TickDataNotifications, and StatsUpdates.
DailyTickDataStatus is for publishing events related to the status of TickData’s databases. When data is loaded into a database, an event is published letting downstream consumers of that database know that the data is ready for them to consume. If something goes wrong due to an outage or delay, updates are shared via TickDataNotifications event.
Moreover, TickData application not only captures real-time tick data, but it also computes minutely stats in real-time. For example, not all downstream consumers are interested in tick level granularity. Instead, they prefer stats such as askPriceHigh, askPriceLow, bidPriceHigh, bidPriceLow, vwap, etc. aggregated per minute (or whatever time interval that suits their usecase). These updates are published on StatsUpdates event.
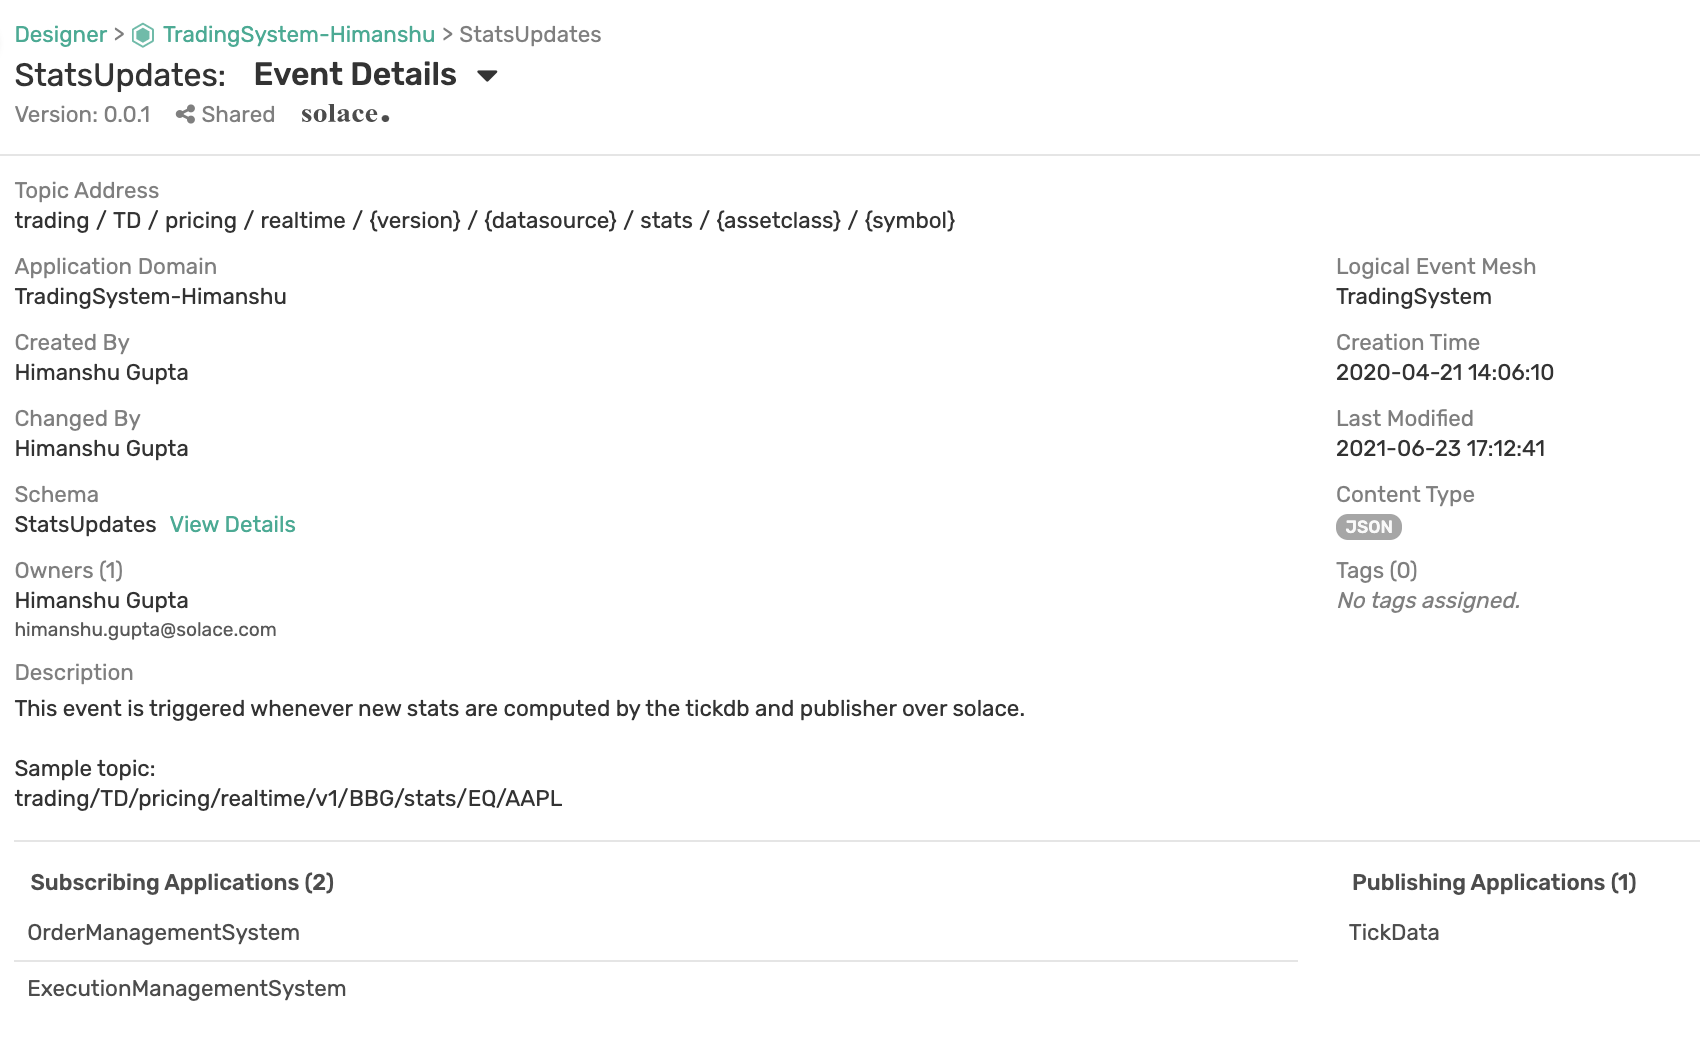
Here is a summary of the StatsUpdates event which tells you which topic it is being published on, event’s owner, brief description, and which applications are publishing and subscribing to this event. As you can see, this event is published only by the TickData application but it is subscribed to by OrderManagementSystem (OMS) and ExecutionManagementSystem (EMS) applications. This information is very valuable because it informs us which applications will need to be notified if and when this event gets modified in the future.
For each event, you can also see its payload’s schema:
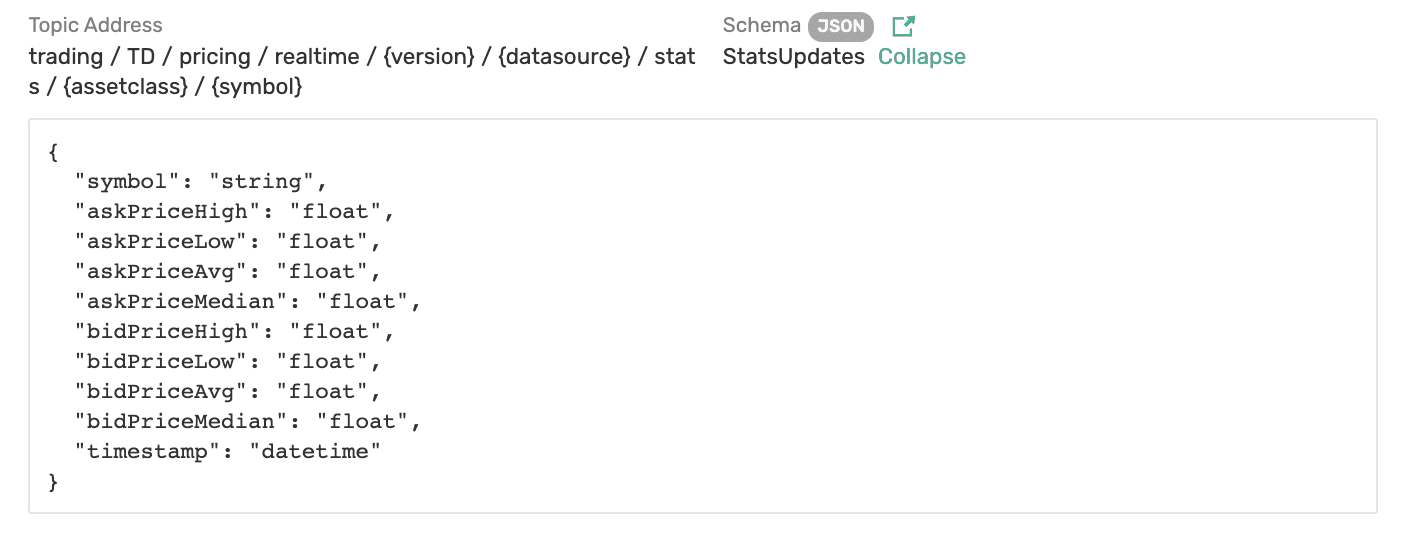
This event has a simple JSON schema but other schema types such as Avro, XML, and Binary are supported as well.
As the name suggests, these two systems are responsible for managing the trade orders and their execution. Many systems combine the two functionalities instead of having separate systems, but in this example, I have shown them as separate.
At a buy-side firm, Order Management Systems (OMS) are generally used by portfolio managers (PMs) to get an overview of the portfolios they manage and to make modifications to these portfolios without worrying about the actual execution(s). For example, a PM might want to reduce exposure to a certain security, i.e., IBM, in their portfolio. They can make that change via an OMS but that change will eventually result in orders being placed via an Execution Management System (EMS).
An EMS is responsible for providing connectivity to different exchanges and trading venues. It is used by traders to execute trades as efficiently as possible with the goal of getting the best execution price.
Going back to the flow architecture, you can see that both OMS and EMS applications subscribe to statsUpdates events. OMS is fine with minute level stats, but EMS requires more granular data to execute order as efficiently as possible. Hence, it also subscribes to marketDataUpdates, and MarketDataNotifications.
The information about which orders need to be executed is published by OMS via the event OMSOrder and subscribed to by the EMS application. Here is more information about the OMSOrder event:
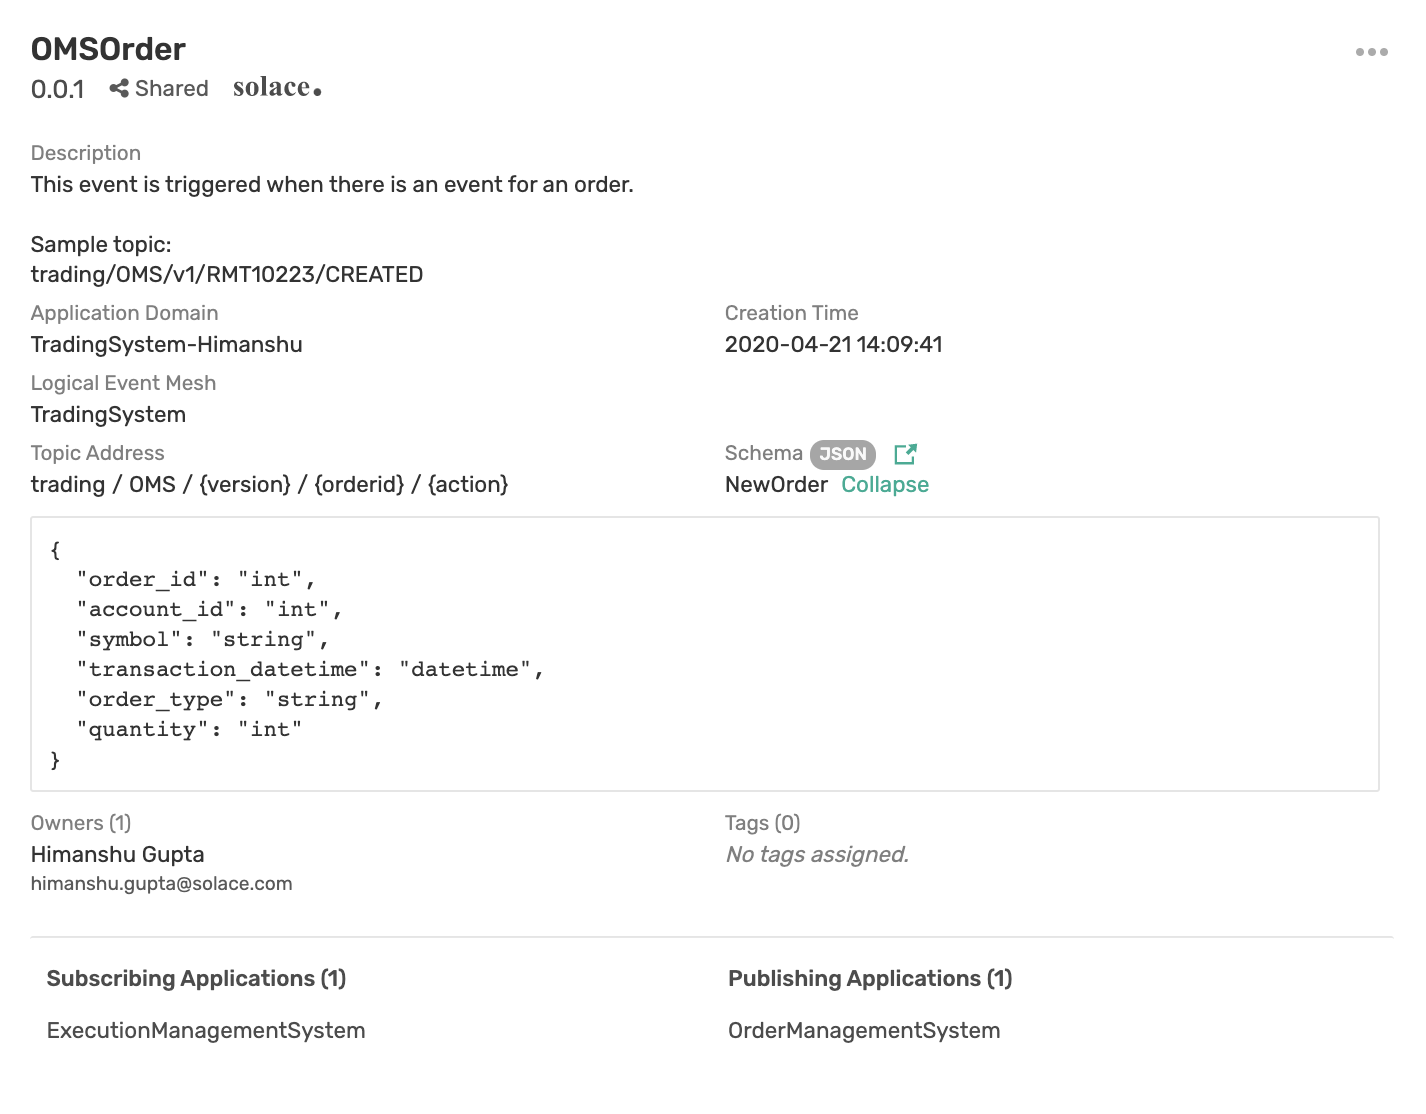
The event is being published on topic: trading/OMS/{version}/{orderid}/{action}
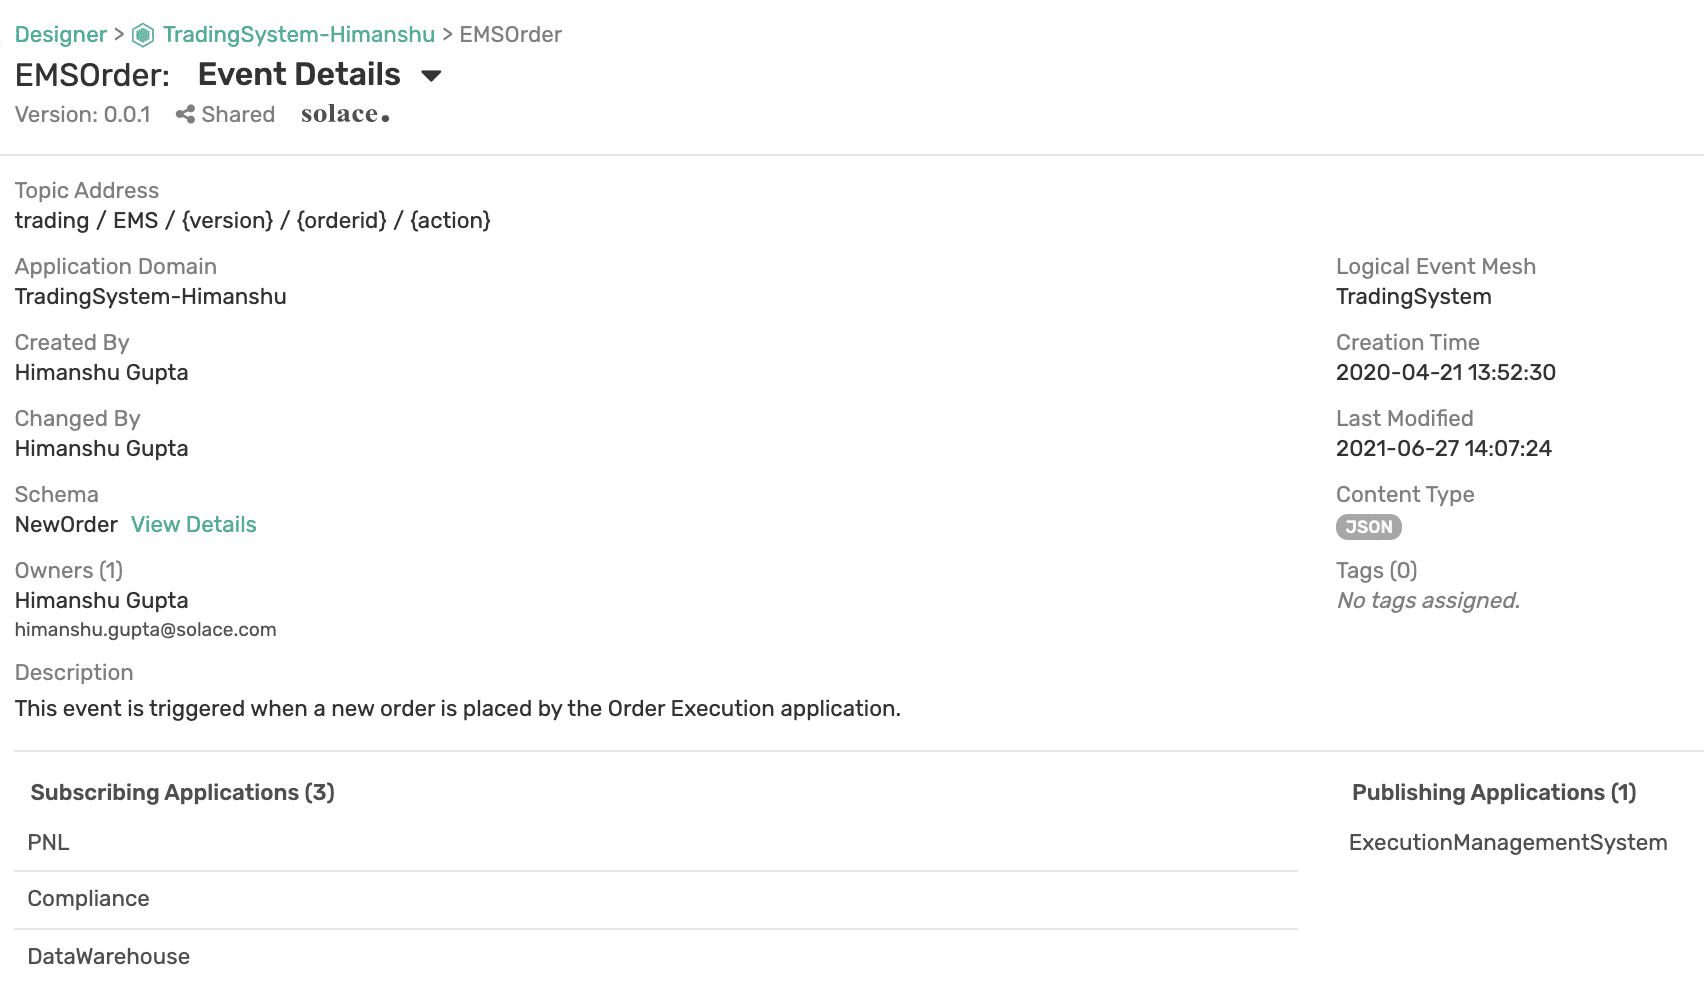
The EMS application publishes EMSOrder event (topic: trading/EMS/{version}/{orderid}/{action}) when it executes an order. This event is subscribed to by the PNL, Compliance, and DataWarehouse applications.
Some asset management firms perform their own analysis on their transactions to analyze whether they are executing their orders as efficiently as they would like. Others offload that responsibility of order execution to a third-party which is then responsible for providing regular TCA reports to the asset management firm.
In this example, the firm is performing some or all transactions themselves and hence is interested in performing its own transaction cost analysis. Such an analysis happens on the previous day’s (as opposed to current day) trading data. Hence, the TCA application is only interested in getting notification data from TickData application instead of real-time updates. The TCA team subscribes to DailyTickDataStatus and TickDataNotifications events to keep track of any outages or issues with databases. Additionally, the TCA application requires trading data which it can directly query from the Data Warehouse application. Since it is not data that is shared in real time via events, it has not been shown in the flow architecture.
Moving on, the PNL application shows existing positions and the associated P&L (profit & loss) so the firm and all the investors can get a snapshot of how their investments have been performing. Different stakeholders require different levels of P&L reports. Large investors like pension funds may only require monthly or quarterly reports whereas the asset management firm’s CEO and portfolio managers might require real-time (~minutely) P&L updates.
The asset management system that this flow architecture is designed for requires real-time P&L dashboards as well as monthly/quarterly reports. That’s why the PNL application is subscribing to real-time data from MarketData application via MarketDataUpdates event. It also needs to keep track of orders so it knows whether a position has been opened or closed which is why it subscribes to EMSOrder event that the EMS application is publishing.
The P&L updates are then published via PNLUpdates event and consumed by the Web Dashboard (PNL) application and Reporting application. The web dashboard displays the real-time P&L and the Reporting application generates monthly and quarterly reports.
Compliance application is part of the regulatory oversight to make sure everything is being run according to general regulations by the governing authority. For example, many trading firms restrict their employees from trading a security within 30-days of their last activity. Some firms restrict their employees from futures or options trading but allow them to trade ETFs intraday. To enforce these rules, employees are expected to share their personal trading activity with the firm. To be able to compare a trader’s personal trading activity with the firm’s trading activity, the Compliance application needs access to both sets of data. The Compliance application can get the firm’s trading activity in real-time by subscribing to the EMSOrder event.
Companies usually have a data warehouse where they store all sorts of data for ad-hoc reporting, analysis, and/or record keeping. For this, the Data Warehouse application can subscribe to certain types of data and record it in a database. In this example, it is subscribing to EMSOrder event but it could have also been subscribing to OMSOrder event.
With so much money at stake, asset management firms implement Risk applications that monitor risks in real-time at both micro and macro levels. For example, a firm would be interested in knowing how the global indices are performing, and if any are experiencing unexpected movement. Additionally, the firm might also want to assess risk at a micro level by keeping track of its positions and portfolios, and ensuring it’s not heavily invested in a particular region, currency, or asset class.
To effectively perform risk analysis, the Risk application would be interested in StatsUpdates from TickData application and EMSOrder event from EMS application, which it will combine to monitor and correlate price movements and order execution.
The flow architecture I showed above was just for the trading system at an asset management firm. There are more applications and a lot more events that flow through applications deployed by such a firm.
As more firms move from batch-oriented polling jobs to real-time event-driven architecture, it becomes important to document not only these events but the entire flow and their dependencies so you can answer questions such as: Who is publishing an event and who are all the applications subscribing to this event? If I change the topic an application is publishing an event to, do I need to notify any downstream applications? Fortunately, these important questions get much easier to answer when you are using the right tool.
I hope this gave you a taste of what Solace PubSub+ Event Portal can do for you, and invite you to register for a trial or request a live demo.
Explore other posts from categories: For Developers | Use Cases


Subscribe to Our Blog
Get the latest trends, solutions, and insights into the event-driven future every week.