
In order to answer the question “what is distributed tracing?”, I would like to revisit the NYC taxi example from my previous blog post. The fictional NYC Modern Taxi Company is struggling to stay relevant in the world of Uber and Lyft, so they rolled out their own ride-sharing app. It went live at midnight… and calls from frustrated drivers who couldn’t log in started rolling in this morning. I don’t have any first-hand experience with NYC taxi drivers lately, but I can’t imagine those were pleasant conversations.
The issue appeared to be with events moving from Salesforce (where account reps recruit potential drivers) into an operations database used by the app itself to assign rides to drivers. But given the number of hops along the way, it’s not clear where the problem lies.
And that’s where distributed tracing saves the day.
By definition, and in contrast to traditional tracing, distributed tracing shows you a searchable, graphical picture of when, where, and how a single event flowed through your enterprise. What distributed tracing allowed NYC Modern Taxi to avoid is shown in the image below.
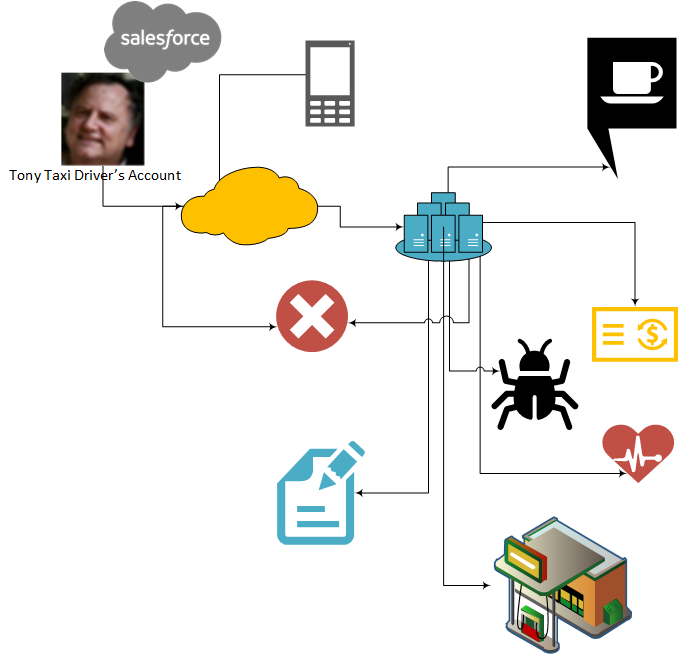
You can see the challenge of following an event from the new rideshare account enter the cloud to an on-premises data center, fan out into multiple different applications (thanks to a pub-sub architecture), slow down in a bottle neck, and then, somewhere, have a programming error stops it completely.
Without distributed tracing, it would have been like finding a needle in a haystack. Not a good time, especially when you have an angry NYC taxi driver named Tony berating you over the phone at 5am.
The Challenge of Event-Driven Integration
NYC Modern Taxi has opted to go the route of event-driven architecture (pause for applause). As you probably know, there are some challenges associated with EDA. One of the biggest is that event driven integration’s greatest strengths – the decoupling of senders and receivers – comes with some caveats.
Think of all the niceties of event-driven integration, made possible by decoupling:
- faster innovation
- buffering in the case of a slow downstream system
- simplified error handling
- spreading information across the globe using an event mesh
But when a publisher sends an event to the broker, the publisher doesn’t know what the broker does with it. The event broker handles the distribution of events to consumers – whether it’s one, 400, or zero – and it doesn’t know what the consumer does with it. That’s a whole lot of not knowing what’s going on, right?
You can write logs to Apache Log4j or Elasticsearch, but that’s not good enough for the real-time demands of event-driven architecture EDA. Tracing an event through hundreds of potential consumers with standard tooling is just… well let’s just say it’s inefficient, at best (brutal, untenable?). Trying to understand the hops an event took along the way can be maddening, especially when you’re talking about the high-pressure scenario of a major go-live event like NYC Modern Taxi’s launch of their rideshare app.
An event portal can help you resolve these issues during the design phase by letting you visualize, govern, and share how and when events fan out. If you go the route of PubSub+ Event Portal, it also looks pretty cool, if I do say so myself!
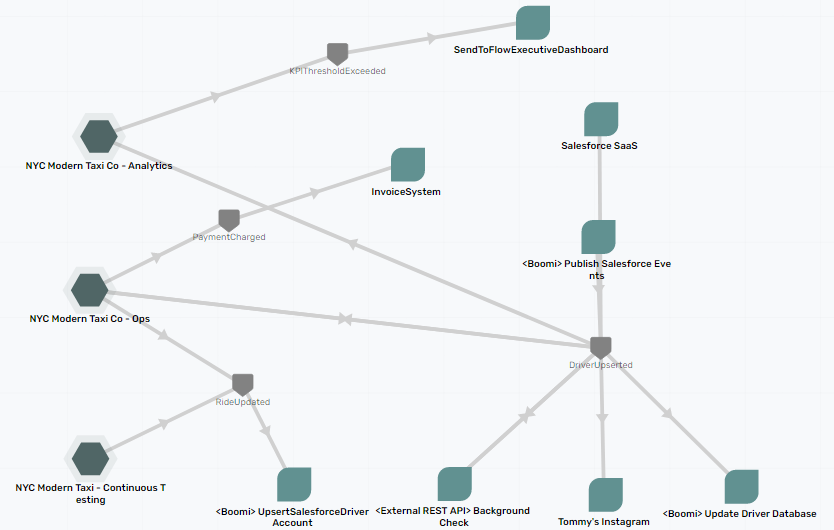
The image above shows what NYC Modern Taxi’s event-driven architecture looks like in PubSub+ Event Portal. To keep things simple, it organizes functionality into different event domains, so the entire architecture isn’t shown here.
So, an event portal covers design time. But what about run time? Understanding and tracing events at run time – with events flowing and Tony the taxi driver on the line – is something you can’t ignore, especially if your solution exploits the power of dynamic topics or selectors.
What is OpenTelemetry for Distributed Tracing?
While we’re talking about the world of EDA here, I’m not suggesting that tracing is easy in the tightly coupled world of synchronous request/reply interactions. In fact, as more enterprises started using microservices, the need for distributed tracing became clear. In fact, developers using microservices tied together with REST calls have long called for standardized distributed tracing.
Those calls spawned an open distributed tracing standard called OpenTelemetry. It unified efforts called OpenTracing and OpenCensus to recreate the elaborate journeys that transactions take as they propagate across a distributed system. Sounds useful for both synchronous REST and event-driven integration, am I right?
So, how does it work? First, let’s go over some terminology1 (also covered nicely in this blog, with a bit more detail than I’ll go into here).
- Spans: the building block of a trace and is a named, timed operation that represents a piece of the workflow in the distributed system. Together, multiple spans form a trace.
- Traces: often viewed as a “tree” of spans that reflects the time that each span started and completed. It also shows you the relationship between spans.
Below is my (really) high-level overview of OpenTelemetry implementation for Tony the taxi driver’s rideshare app account:
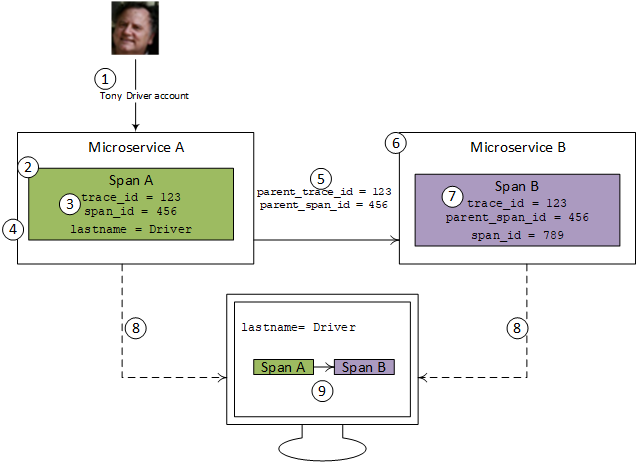
- An account update comes into Microservice A for Tony
- Microservice A creates an OpenTelemetry span, which is a single piece of an end-to-end trace
- The span automatically is randomly assigned a span_id, which identifies this particular span, and a trace_id, which identifies the full end to end trace the span is a part of.
- Microservice A also adds business-relevant information to the span, such as the patient’s last name, to make searching easier.
- Microservice A adds the span_id and the trace_id to the headers of a request over to Microservice B.
- Microservice B receives the request with the headers.
- Microservice B creates Span B. It uses the same trace_id, and specifies that Span A is its parent span. This creates the linkage between Span A and B.
- After microservice A and B complete, the spans head off to a collector.
- The collector then reassembles the traces in a searchable, graphical format.
This is obviously a simple example but if you start increasing the number of spans and imagine a chain of Span B calling Span C calling Span D, you can see why distributed tracing quickly becomes not just valuable, but a necessity.
OpenTelemetry with Event-driven integration – What is the Benefit of Distributed Tracing?
The ideal way to implement OpenTelemetry is through an instrumented framework or API that handles the details of creating spans and injecting and extracting information from the headers.
Although distributed tracing is more important for event-driven integration than for synchronous implementations, the ecosystem is less mature. If you search the documentation for instrumented async APIs and frameworks, there’s not much there – hopefully that will change soon.
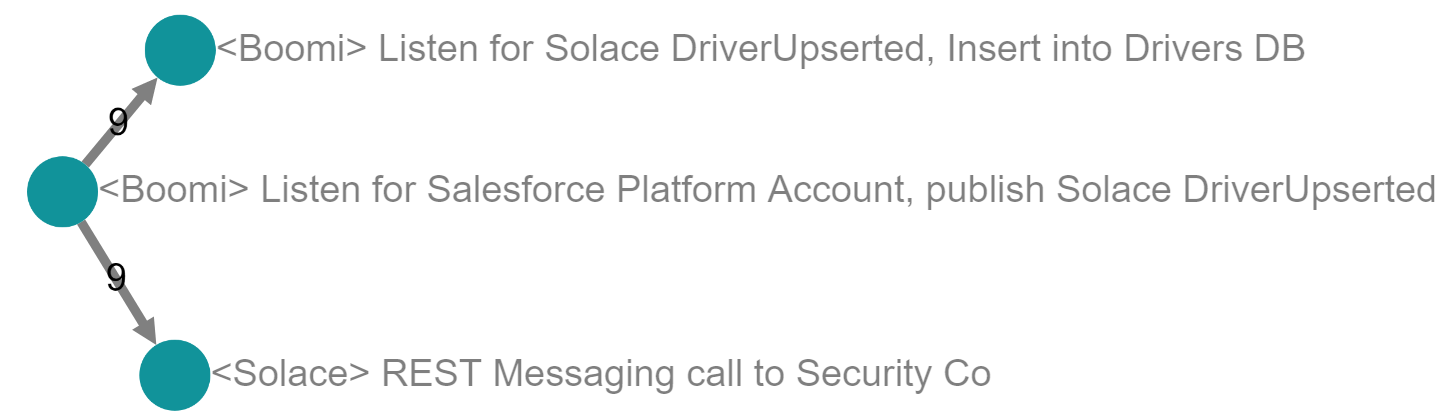
We have even published a codelab for those of you who prefer hands-on learning!
These are the steps that the codelab will walk you through:
So how can you create powerful implementations for event-driven integration with distributed tracing? Fortunately, events and event brokers offer everything you need to start with OpenTelemetry: event APIs written in common languages, and headers in which you can stash span and trace IDs. You just have to get a little bit closer to the API, manually inject headers into events, and manually extract them to start a new span.
The benefit of that little bit of work is a lot of clarity about the run-time state of your event-driven architecture. Taking my NYC Modern Taxi example, instead of searching through logs and correlating ElasticSearch entries, OpenTelemetry shows multiple graphical views of where, when, and how long Tony’s new account event took at each step of the process.
Considering again my NYC Modern Taxi example, OpenTelemetry relieves you of the need to search through logs and correlate ElasticSearch entries by giving you graphical views that let you see exactly what happened every step of the way as your system tried to provision Tony’s new account, including both when it happened and how long it took.
The first view, called a “directed graph” presents a high-level run-time view of where events are going in your system. It matches the design in PubSub+ Event Portal, if you care about that sort of thing (I do).
Nothing looks amiss yet. But distributed tracing lets you go beyond aggregate numbers and observe each event as it flows through your enterprise. Here’s an example; let’s see if we can find out what’s going wrong:
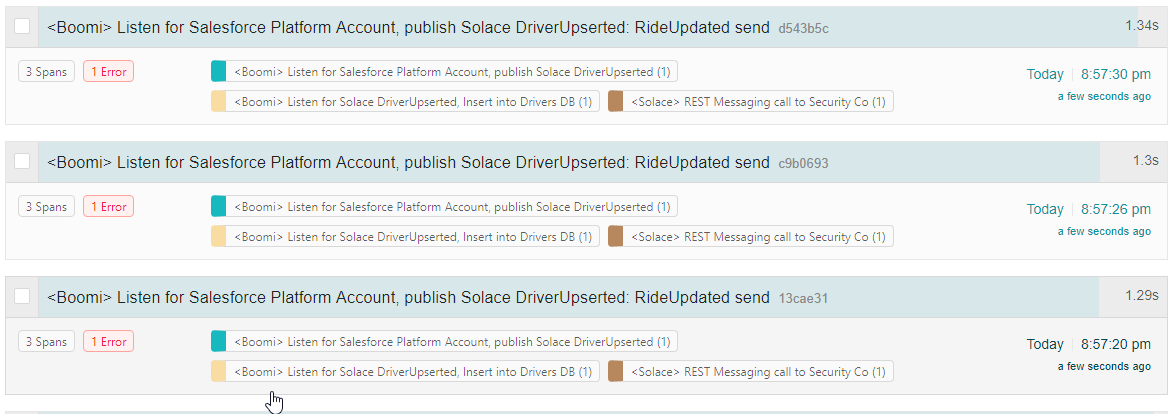
Clicking on a single transaction yields the next view called a “flame graph”. It shows the order of service calls and the timings for each microservice. The flame graph gives an even better clue as to why Tony’s account isn’t ready yet.
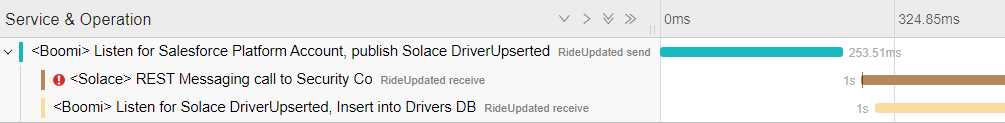
Drilling down into the REST messaging call span, it shows the (very common) culprit: an expired certificate.
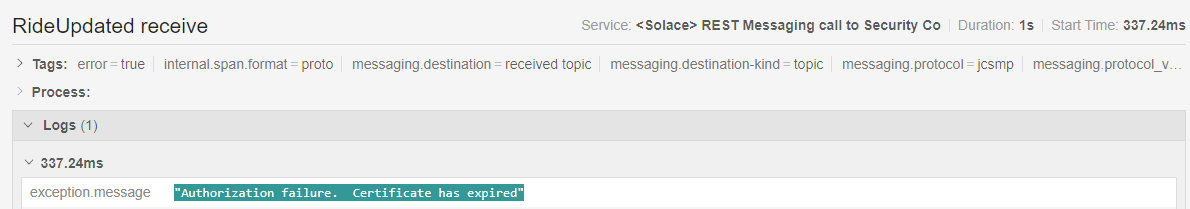
A quick call to SecurityCo gets the certificate back in order and Tony’s account is up and running in no time.
These graphical views, along with the ability to search for business-relevant information, lets you troubleshoot tricky issues faster, which in turn lets you offer your drivers –or whoever your customers are –a much better experience.
Conclusion
While distributed tracing began as an effort to solve issues in the synchronous API world, it fits even better into event-driven architecture. OpenTelemetry gives you the tools to keep track of your events as they fly through your enterprise—and hopefully keep Tony off your support helpline.
Don’t forget to check out the codelab!
These are the steps that the codelab will walk you through:


Subscribe to Our Blog
Get the latest trends, solutions, and insights into the event-driven future every week.
By submitting this form, you agree to Solace’s privacy policy: solace.com/privacy-policy/